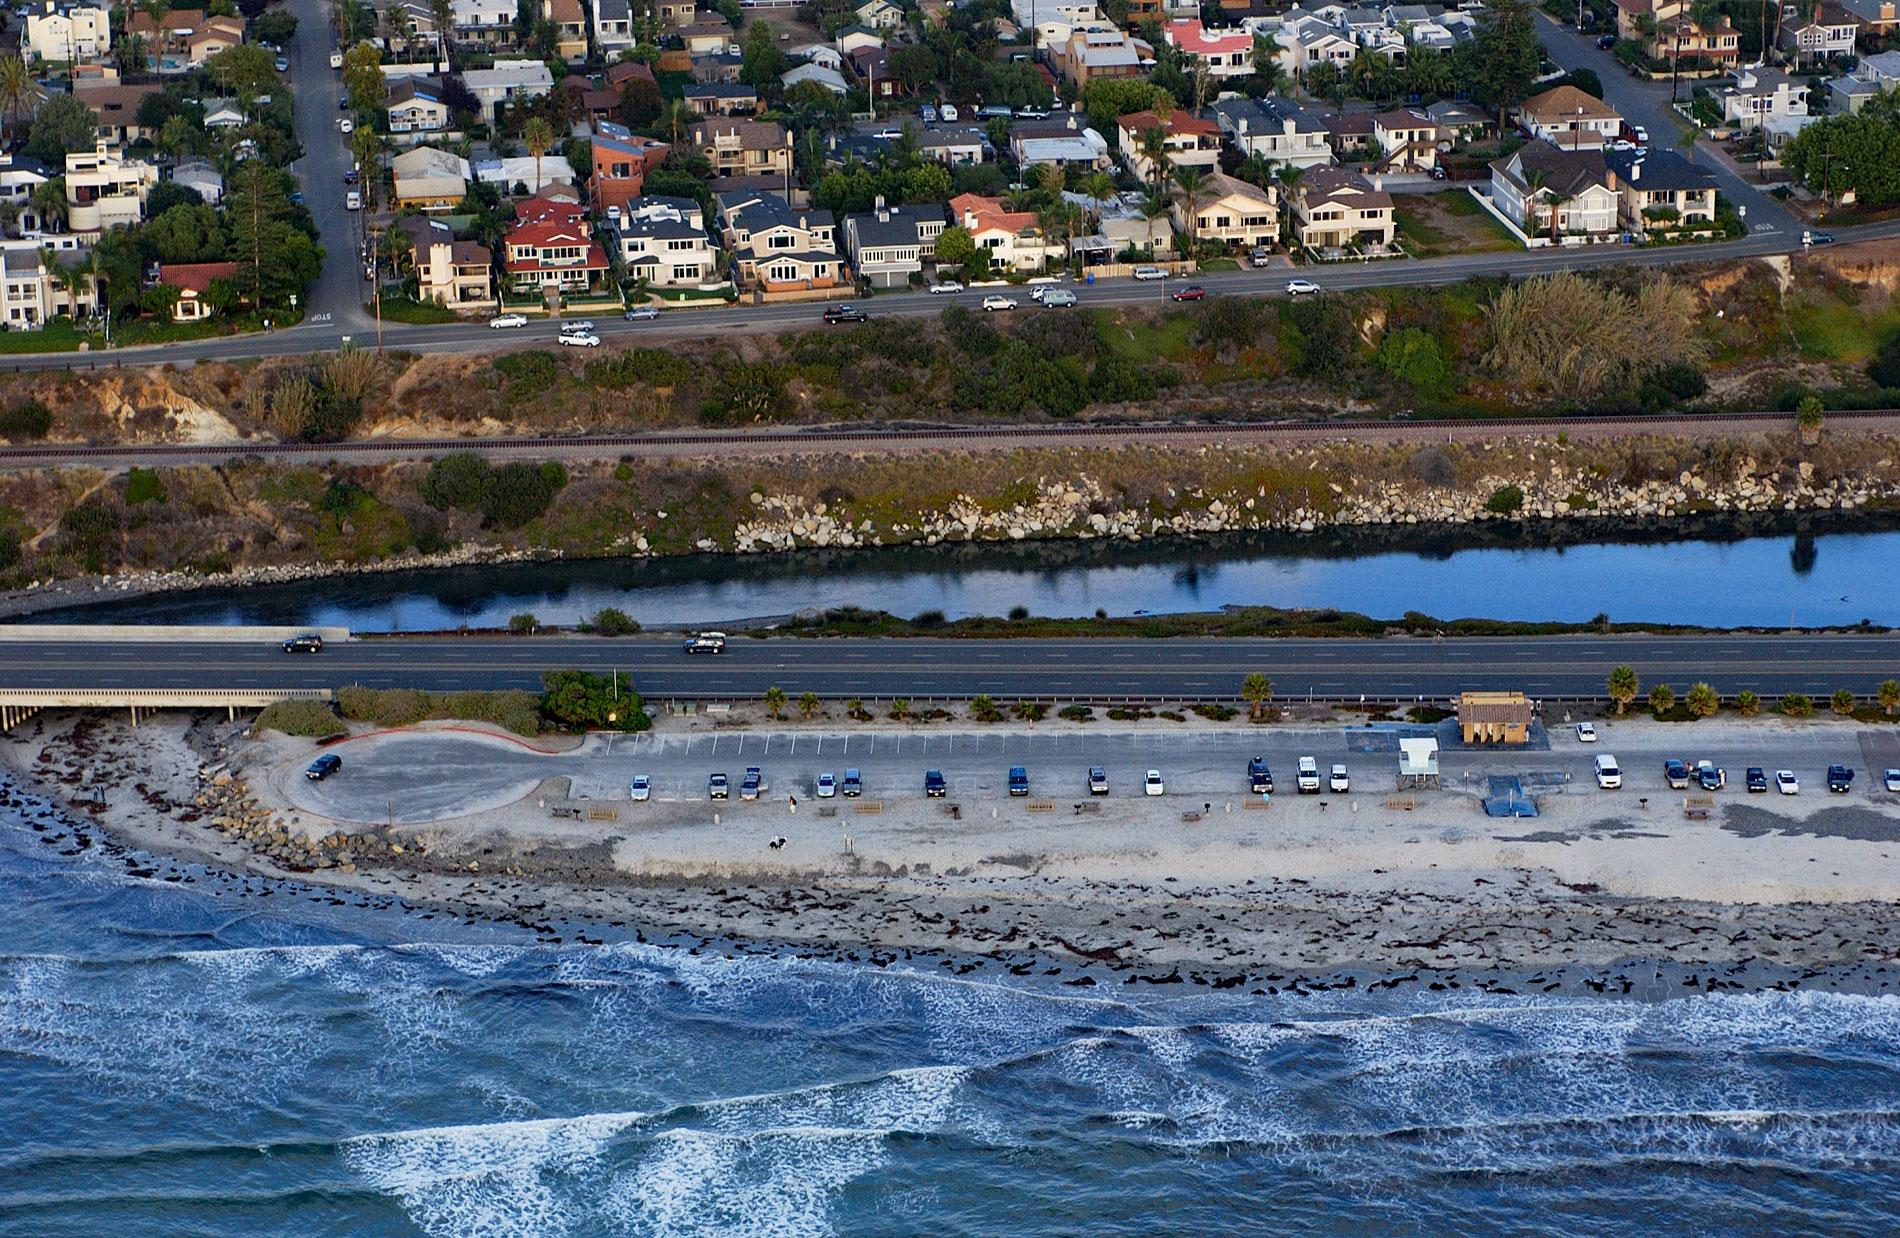
San Elijo Lagoon is 915 acres (370 ha) of tidal wetlands formed by Escondido Creek that drains a watershed of 54,000 acres (22,000 ha) and flows generally southwest for 26 miles (42 km) to the Pacific Ocean at Cardiff, or Cardiff-by-the-Sea, a beach community in Encinitas, about 89 miles (144 km) southeast of Los Angeles and 21 miles (34 km) north-northwest of San Diego, California. The community is named after Cardiff, Wales. The area including the lagoon was named ‘San Alejo’ in 1769 by the Portola Expedition in honor of Saint Alexius. The lagoon is constrained to the north and south by rocks of the Delmar Formation exposed in seashore cliffs and overlayed by Torrey Sandstone. The formation consists of dark green claystone and mudstone, and greenish-gray muddy sandstone that developed during the Eocene period when sediments accumulated in a large ancient lagoon. The present lagoon is one of the largest remaining coastal wetlands in Southern California, and supports unique plant communities including coastal strand, salt marsh, riparian scrub, coastal sage scrub, freshwater marsh, and mixed chaparral. The water from Escondido Creek is used for agricultural irrigation, municipal and domestic supply, recreation, and wildlife habitat. These requirements result in low river discharge that allow winter storms to build a sand bar that blocks the lagoon mouth at Cardiff State Beach. The sand is mechanically dredged each spring to reopen the lagoon and restore tidal circulation to the lagoon.
The lagoon and surrounding lands are the traditional territory of the Ipai tribe that are part of the Kumeyaay people. The Kumeyaay also consist of the Tipai tribe that lived to the south and the Kamia that lived to the east. They were all referred to as the Diegueño by the Spanish. In 1769, the Spanish started colonizing Alto California with the construction of 21 missions along the coast. In 1821, following the Mexican War of Independence, the mission lands were secularized and much of the land was granted to prominent Mexican soldiers. In 1842, Rancho Las Encinitas was a land grant of 4,434 acres (1,794 ha) given to Andrés Ybarra by Governor Juan Alvarado. The grant was named ‘Los Encinitos’ which means ‘little oaks’ but was later misspelled as ‘Las Encinitas’. The grant extended north for 5 miles (8 km) from San Elijo Lagoon to Batiquitos Lagoon. In 1860, Ybarra sold the property and thereafter it was exchanged by several owners until 1875 when the pioneer MacKinnon family developed a farm and grew barley and corn, plus an orchard. In 1909, J. Frank Cullen purchased and subdivided the land for residential lots. Frank Cullen’s wife was a native of Cardiff, Wales, and persuaded him to name the community ‘Cardiff-by-the Sea’.
When the lands surrounding San Elijo Lagoon and Escondido Creek were developed, the area began to undergo vegetational modifications, mainly due to farming and cattle grazing. Between 1934 and 1973, sewage from various sources was discharged directly into the lagoon, and between 1937 and 1971, numerous dikes and levees were installed to construct duck ponds for hunting. In 1983, the lagoon was designated as the San Elijo Lagoon Ecological Reserve by the California Fish and Game Commission to preserve and maintain the coastal wetland habitat and the associated flora and fauna. In 2010, Swami’s State Marine Conservation Area was established as a marine protected area of 8,096 acres (3,276 ha) that extends 3.5 miles (5.6 km) offshore between Cardiff State Beach at San Elijo Lagoon to the south and Moonlight State Beach to the north. The conservation area includes a concentration of rocky reef, kelp forest and surf grass habitat, and limits the removal of marine wildlife from within its borders. The area is named for the popular surf location at Swami’s, famous for a smooth and consistent wave shape. Read more here and here. Explore more of San Elijo Lagoon and Cardiff here:

