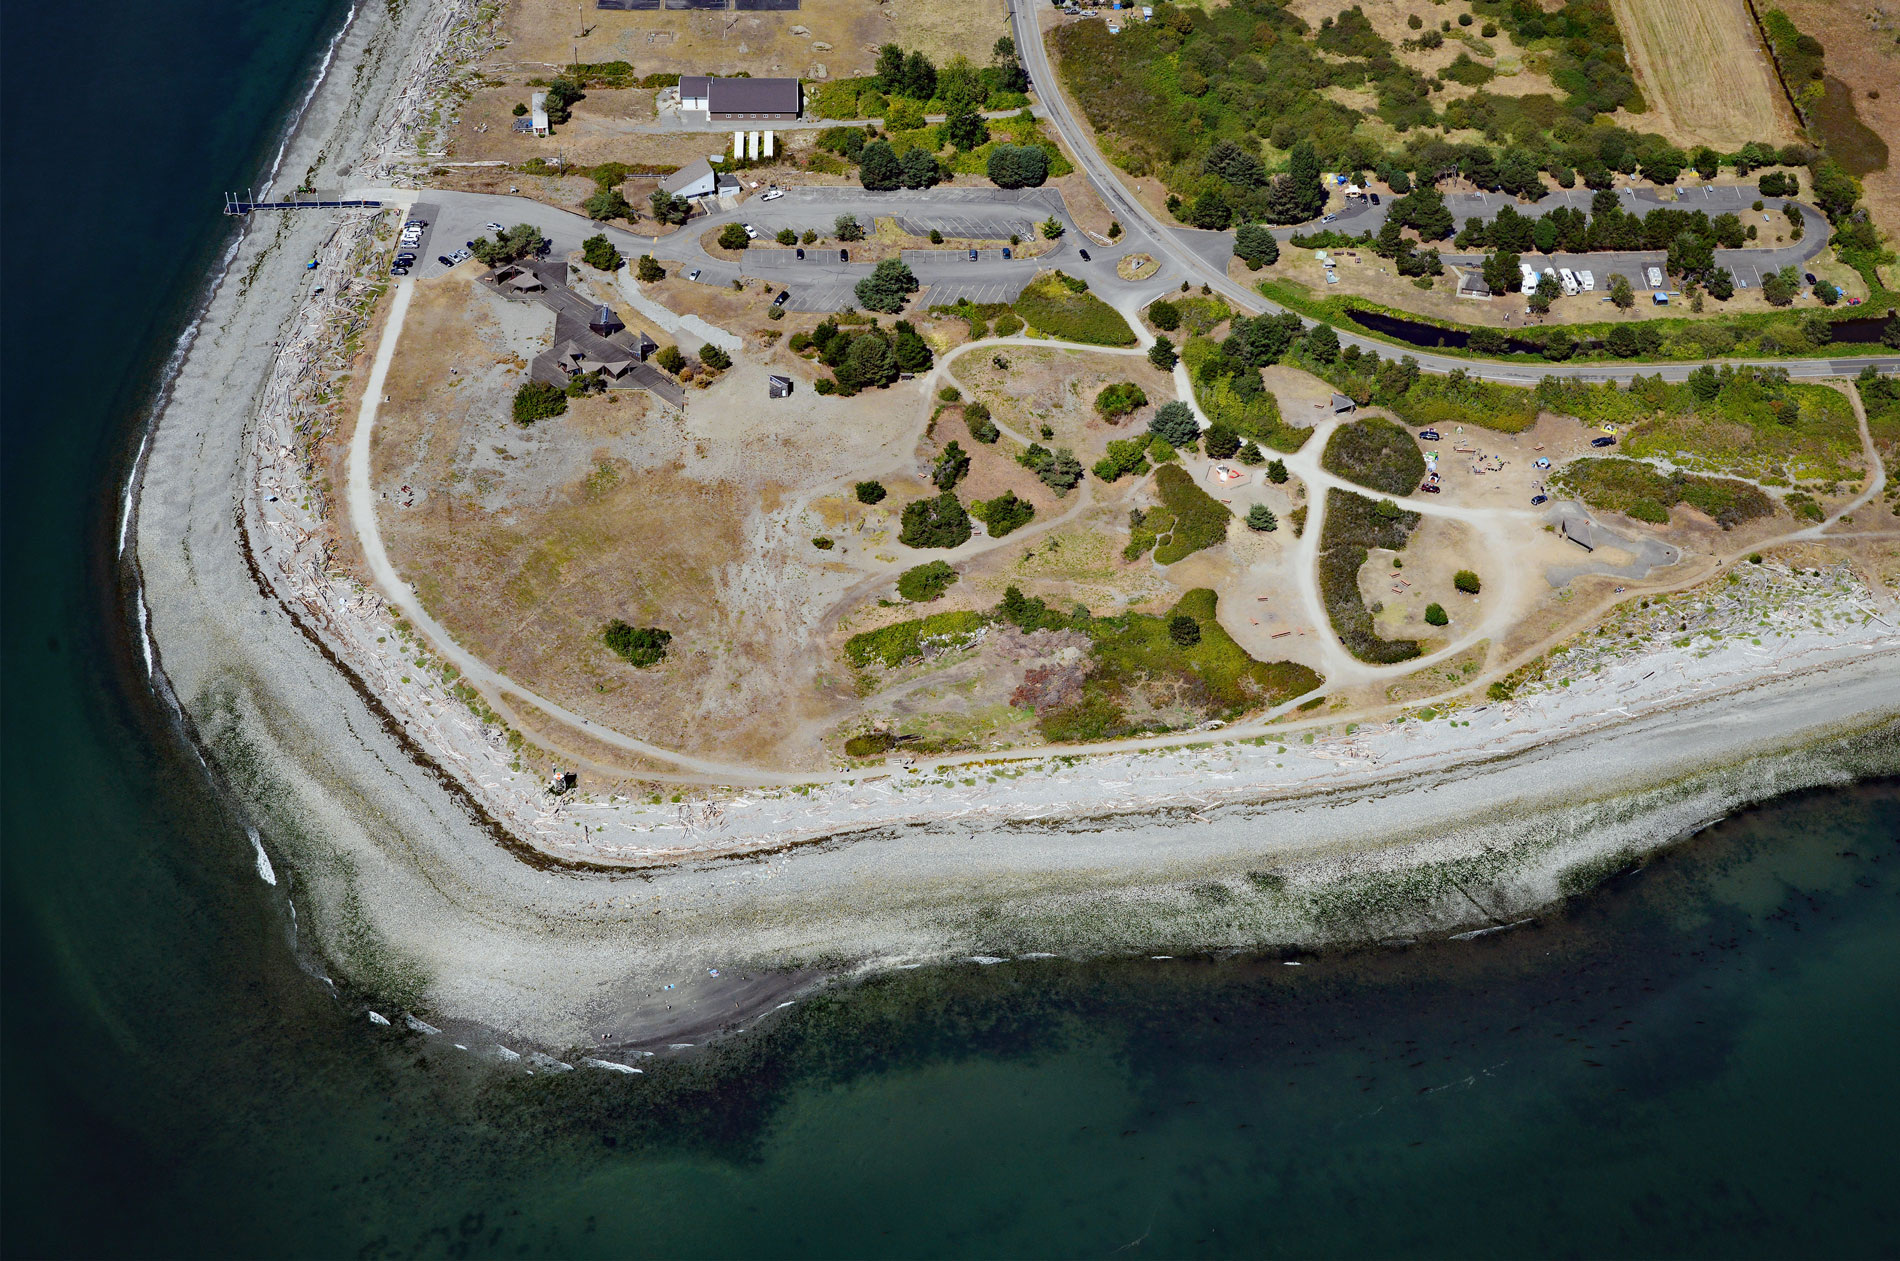
Point Roberts is a community situated on 3,136 acres (1,269 ha) of the southern tip of the Tsawwassen Peninsula and represents an exclave of the United States in the Strait of Georgia, about 32 miles (52 km) northwest of Bellingham and 15 miles (24 km) west of Blaine, Washington. Captain George Vancouver named Point Roberts after his friend Henry Roberts. The Strait of Georgia is about 150 miles (240 km) long and varies in width from 12 to 36 miles (20 to 58 km) between Vancouver Island to the west and the southwestern mainland of British Columbia to the east, and along with the Strait of Juan de Fuca and Puget Sound, is part of the Salish Sea. The Tsawwassen Peninsula is formed by the Fraser River delta to the north, the Strait of Georgia to the west and south, and Boundary Bay is to the east. The peninsula is composed of sediments deposited during the Holocene after the retreat of the Cordilleran Ice Sheet. These sediments vary between sand, silt, clay, and peat, and extend to a depth of 984 feet (300 m) over an irregular Pleistocene erosion surface.
The Tsawwassen Peninsula is the traditional territory of the Tsawwassen First Nation, a Coast Salish people, who may have lived in the area for over 4,200 years based on the age of the oldest archeological site found. Point Roberts was also the location of summer fish camps for the Cowichan, Lummi, Saanich, and Semiahmoo tribes, but few people lived here year-round because of the exposure to weather. The first Europeans to see Point Roberts were members of the 1791 expedition of Francisco de Eliza. The maps produced from Eliza’s explorations depicted Point Roberts as an island called ‘Isla de Cepeda’. In 1792, two ships under the command of Dionisio Alcalá Galiano sailed into Boundary Bay and verified that Point Roberts was not an island and was renamed Punta Cepeda. They then sailed around Point Roberts and immediately encountered HMS Chatham, the second ship of Vancouver’s expedition. The two parties made contact and agreed to share information and work together in mapping the Strait of Georgia.
In 1846, joint occupation of the Oregon Country ended when Great Britain and the United States signed the Oregon Treaty, establishing the 49th parallel as the boundary between the countries from the Strait of Georgia to the Continental Divide in Montana. Not until the boundary was surveyed was it realized that Point Roberts would become an isolated part of the United States. In 1859, the United States established a military reserve at Point Roberts, though no military presence was established, and subsequently Point Roberts evolved into a lawless haven for smugglers. In 1892, the military vacated the reserve, and in 1908, the land became available for homesteading. People of Icelandic descent moved to Point Roberts from Victoria and established a town on the western shore of Point Roberts and some farmed and others worked for the salmon cannery at Lily Point. In 1908, the federal government bought 21 acres (8.5 ha) at the end of the peninsula for a light station which was never built; however, a lighted aid to navigation on a skeleton tower now overlooks the Strait of Georgia. The property was eventually transferred to Whatcom County and is now part of Lighthouse Marine Park operated by Whatcom County Parks and Recreation. Read more here and here. Explore more Point Roberts and the Strait of Georgia here:

