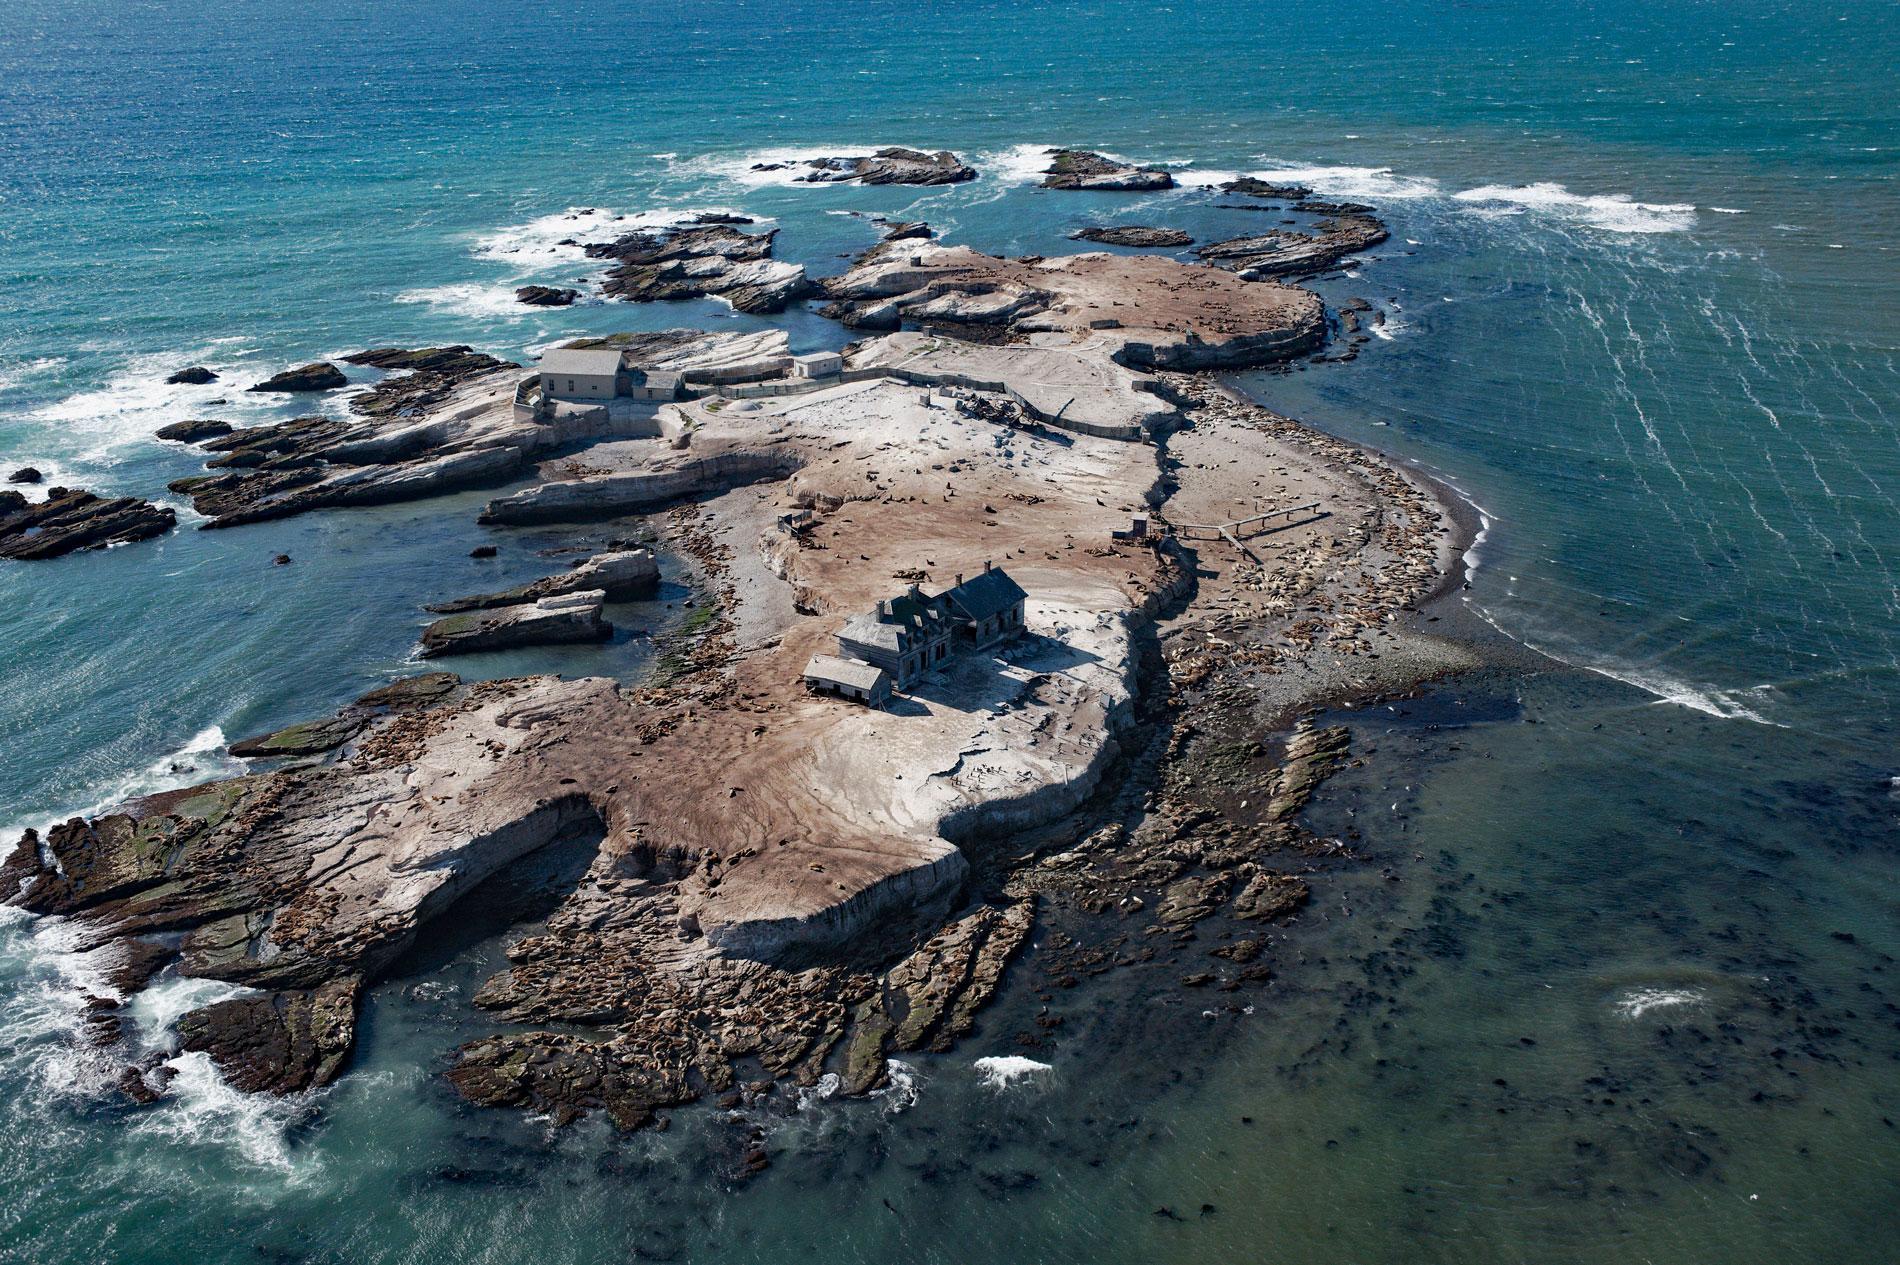
Año Nuevo Island is the site of a historic light tower and fog signal on about 9 acres (3.6 ha) and separated from Point Año Nuevo by a shallow channel encompassed by Año Nuevo State Park, about 21 miles (34 km) northwest of Santa Cruz and 11 miles (18 km) south-southeast of Pescadero, California. The point was named by Father Antonio de la Ascensión, the chaplain for maritime explorer Sebastián Vizcaíno, who sailed by the point on the first day of the new year in 1603. At that time, the island was connected to the mainland and has since been separated by erosion of the headland. The island and point represent rocks of the Monterey Formation that developed during the Miocene and consist of light grey to whitish mudstone. The formation varies in thickness from 395 feet (120 m) to more than 1,968 feet (600 m). The bedrock on the mainland is mostly covered by sand dunes and marine terrace deposits. The marine terraces that represent much of the mainland topography were formed by wave erosion during the Pleistocene in response to fluctuating sea levels and regional uplift. The mudstone cliffs at Año Nuevo Point are eroding at about 1 foot (0.3 m) per year and the submerged wave eroded platform now separating the point from the island has opened to a width of 0.5 miles (0.8 km) in the 400 years since Vizcaíno’s visit.
The Quiroste Ohlone people were the first known people to inhabit the Año Nuevo area. Mission Santa Cruz was founded in 1791 and the Quiroste population plunged due to introduced diseases. By 1816, Mission Santa Cruz established a cattle ranch at Punta de Año Nuevo. After the Mexican War of Independence in 1821, the mission lands were secularized and dismantled into land grants to promote settlement. In 1842, a land grant of 17,753 acres (7,184 ha) called Rancho Punta del Año Nuevo was given to Simeon Castro by Governor Juan B. Alvarado. The grant extended from Arroyo de los Frijoles in the north to Point Año Nuevo in the south. In 1851, Maria Antonio Pico de Castro sold the rancho to Santa Cruz pioneer Isaac Graham. In 1862, Jeremiah Clark and Loren Coburn of San Francisco purchased Rancho Punta del Año Nuevo and leased much of the land to a dairy enterprise run by the Steele family who eventually bought 7,000 acres (2,833 ha). Several high-profile shipwrecks including the Carrier Pigeon lost in 1853, followed by Sir John Franklin in 1865, and the Coya in 1866, prompted a demand for light stations along this coast. In 1870, the U.S. Congress provided funding for the Lighthouse Board to purchase property from Coburn for lighthouse reserves, and in 1871, appropriated funds to construct navigation aids at Pigeon Point and Año Nuevo Island.
A lighthouse was first built at Pigeon Point, and only a fog signal was constructed on Año Nuevo Island that first operated in 1872. On average the fog signal was in operation roughly 700 hours a year and consumed about forty tons of coal per year. To collect water for the steam whistle, the facility included a water catchment basin and cistern. In 1890, a light was mounted on a post on the seaward side of the fog signal to improve the station’s effectiveness. In 1905, a nine-room two-story structure was completed to house the light keepers and their families, and in 1907, a 15,000-gallon redwood water tank was built. In 1911, a lantern room was added on top of the water tank to house a new Fresnel lens, and in 1914 the light was transferred to a taller steel skeleton tower. The station was deactivated in 1948 and replaced by a whistle buoy south of the island. In 1976, the steel light tower was cut down. The historic fog signal buildings are now used as a laboratory and dormitory for the Institute of Marine Sciences at the University of California Santa Cruz. In 2007, the Año Nuevo State Marine Conservation Area was established to protect marine life. Point Año Nuevo is used by thousands of breeding seabirds and marine mammals and supports a world-famous elephant seal haul out and breeding ground. The waters surrounding the point attract a concentration of great white sharks and include habitat for depleted canary rockfish and feeding area for threatened marbled murrelets. Read more here and here. Explore more of Año Nuevo Island and Año Nuevo State Park here:

