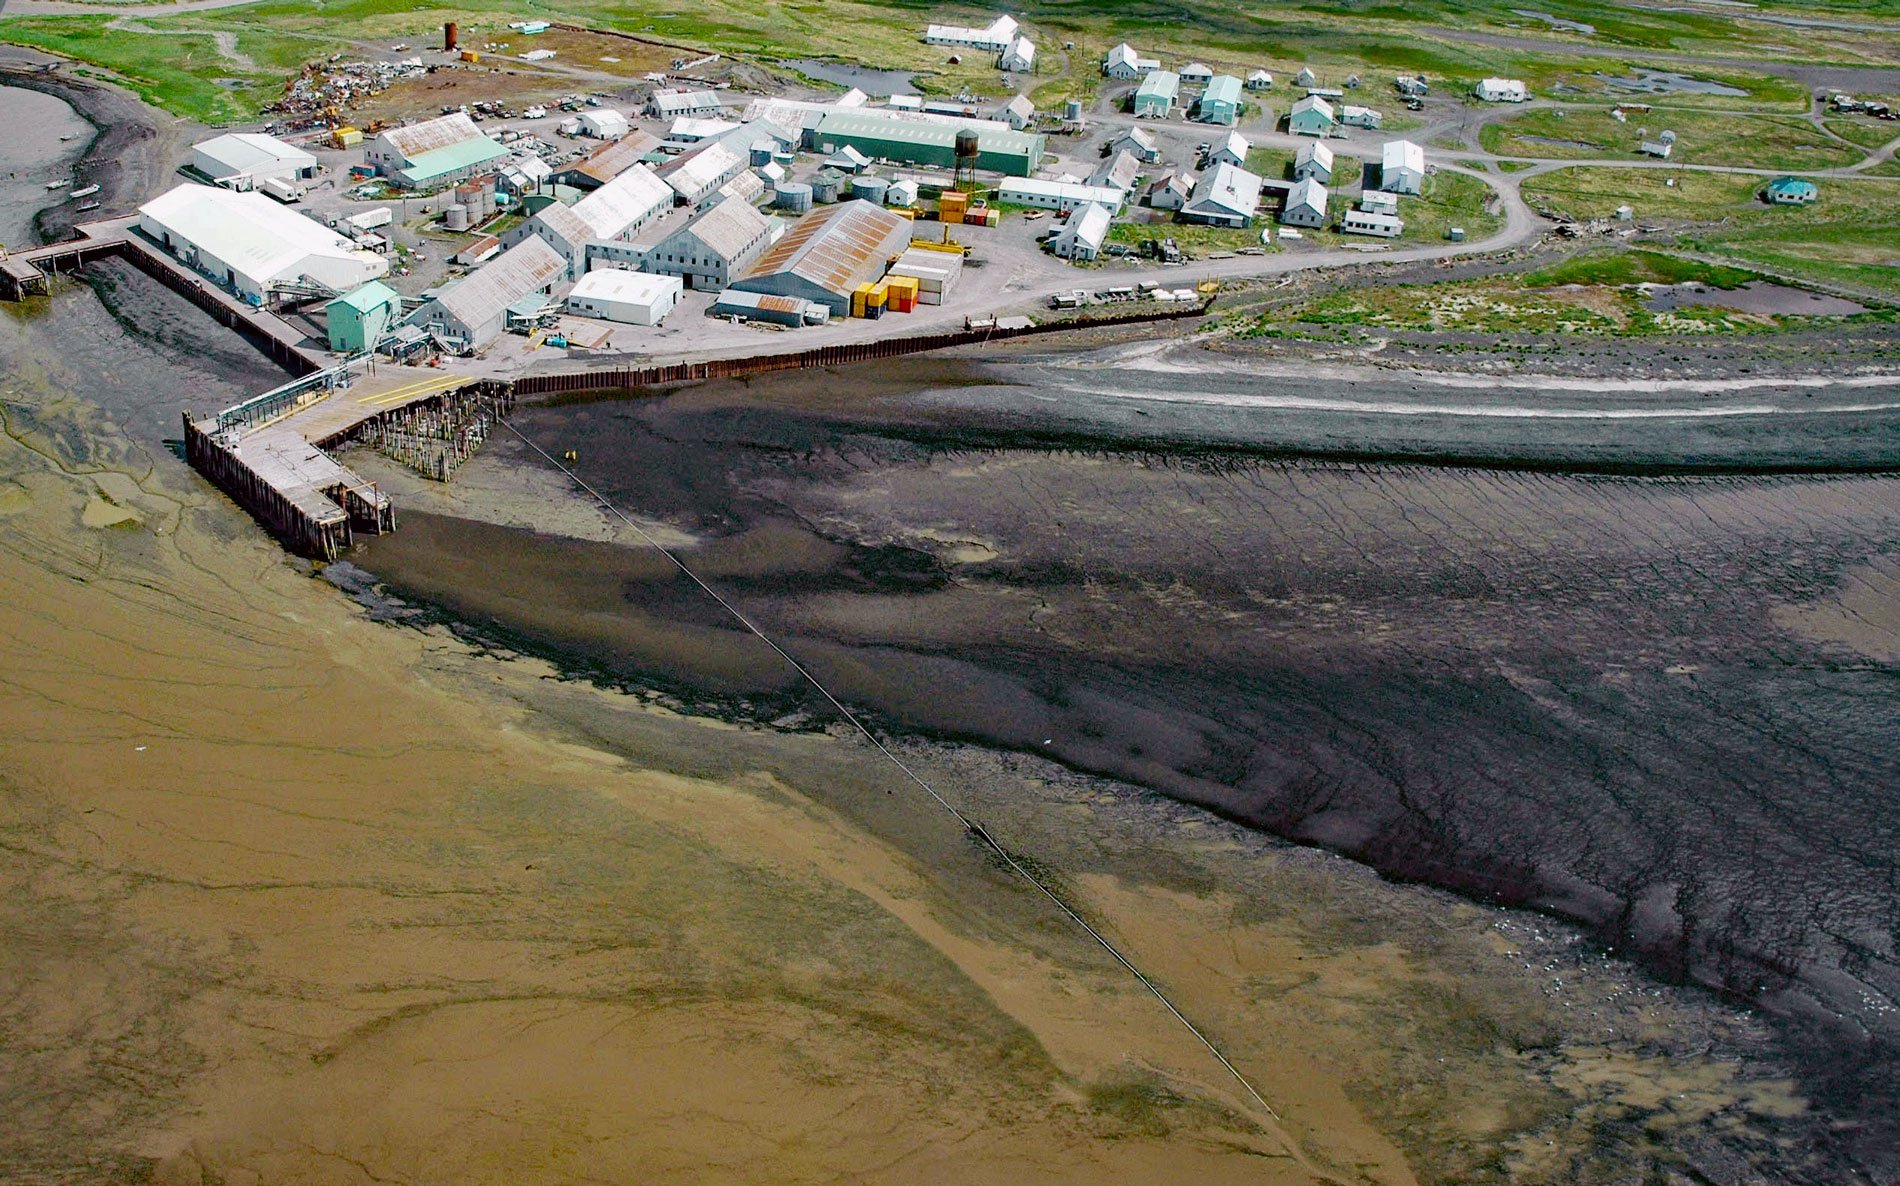
Ekuk is a small village located on Ekuk Spit on the eastern shore of Nushagak Bay, a branch of Bristol Bay, about 16 miles (26 km) south-southwest of Dillingham and 1.3 (2.1 km) miles southwest of Clarks Point, Alaska. This was originally a Yup’ik settlement first reported in 1828 by F.P. Lutke, a Russian navigator, geographer, and Arctic explorer. Russian accounts first document the village in 1824 as Village Ekouk. The name “Ekuk” means “the last village below”, and refers to it being the southernmost village of Nushagak Bay.
Ekuk Spit is seaward of steep bluffs that extend to the north and south along Nushagak Bay. Ekuk village is currently visited seasonally by fishing families and workers for the Ekuk Fisheries processing plant. The community of Ekuk comprises a number of fishing shacks, seasonally-occupied residences, the Ekuk Fisheries plant, a few gravel roads, and a landing strip for light aircraft. The cannery is on the north end of the spit and supports a set-net fishery that extends from Ekuk southward along the shore past Ekuk Bluff to Flounder Flat. Set-net fisheries, both commercial and subsistence, extend from high tide seaward through the intertidal zone of the shoreline into the subtidal zone. The shoreline is also used for barge access and driftwood collection.
Several canneries opened in Nushagak Bay between 1888 and 1889. In 1903, the North Alaska Salmon Company built a cannery in Ekuk that employed many village residents. In the 1940s, Wards Cove Packing Company built another cannery that operated until 2002 when it closed because of the drop in salmon prices and the decreased participation in the fishery. Today, Ekuk Fisheries operates a salmon processing facility out of the former Wards Cove plant. Read more here and here. Explore more of Ekuk Fisheries here:

