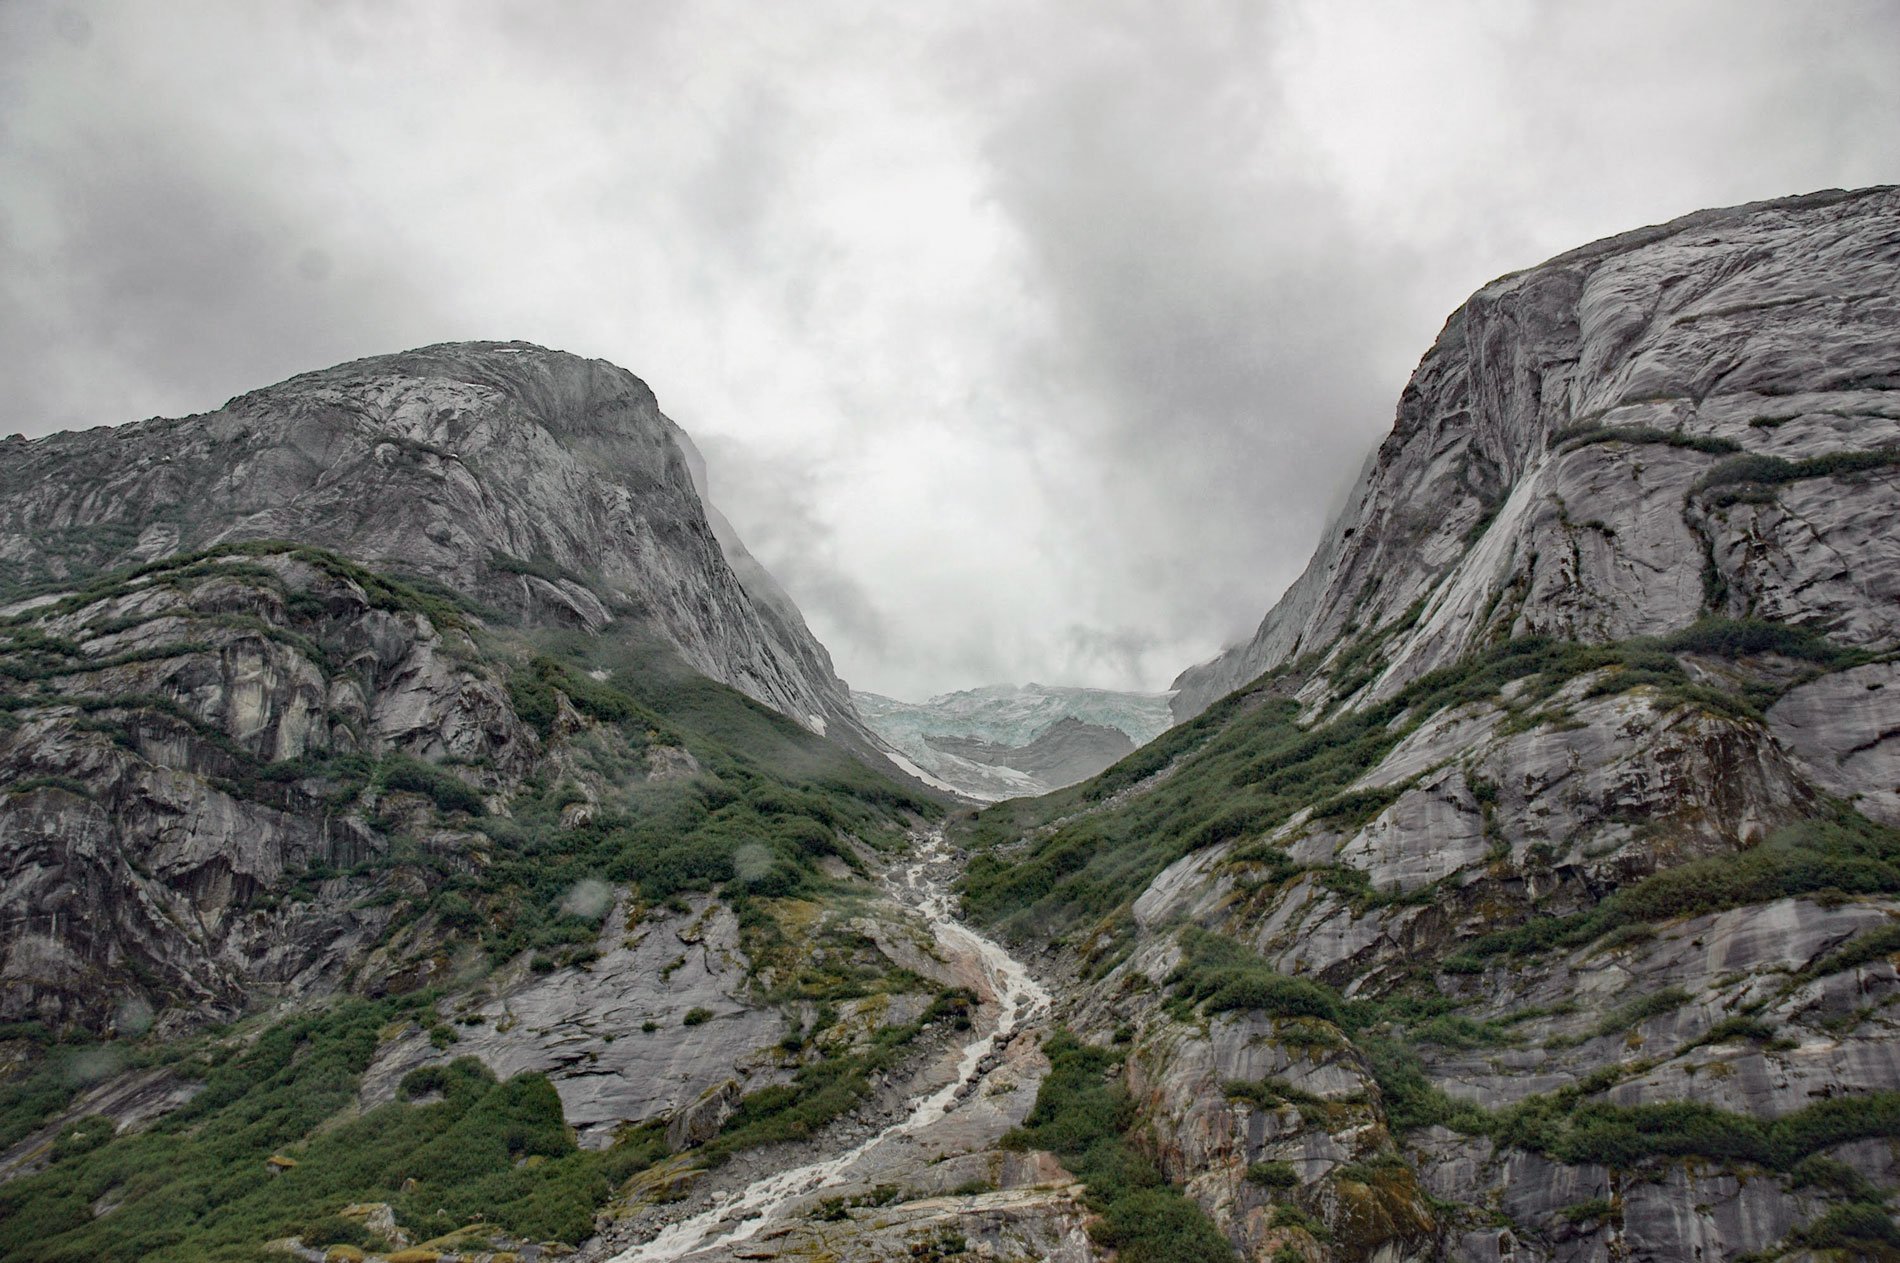
An unnamed glacier hangs above a cirque on the southern shore of Endicott Arm, a fjord in the Coast Mountains of Southeast Alaska that extends northwest for 33 miles (53 km) from the terminus of the Dawes Glacier to Holkham Bay, 80 miles (129 km) southeast of Juneau and 47 miles (76 km) north of Petersburg, Alaska. The fjord was named in 1889 by Lieutenant Commander H.B. Mansfield of the U.S. Navy, for William Crowninshield Endicott, the Secretary of War under President Grover Cleveland from 1885-89.
Cirque glaciers form in conditions that are favorable for snow accumulation such as north-facing slopes protected from sun exposure and prevailing winds. These areas are sheltered from heat and wind ablation, encouraging the accumulation and retention of snow that, if sufficient in volume, will turn into glacial ice. The process of nivation follows, whereby a hollow in a slope may be enlarged by ice weathering and glacial erosion. Ice weathering erodes the vertical rock face and causes it to disintegrate, forming concave, circular basins called cirques.
Cirque glaciers that reside in these basins and have a characteristic circular shape, with their width as wide or wider than their length. Cirque lakes often form when these glaciers melt. High above this cirque basin in Endicott Arm is an unnamed hanging glacier, a remnant of a much larger valley glacier that once flowed to Endicott Arm and joined with the Dawes Glacier. When a major valley glacier system retreats, tributary glaciers may remain in smaller valleys high above the shrunken central glacier surface. These are called hanging glaciers. If the entire glacial system has melted and disappeared, the empty high valleys are called hanging valleys. Read more here and here. Explore more of Endicott Arm and the cirque glacier here:

