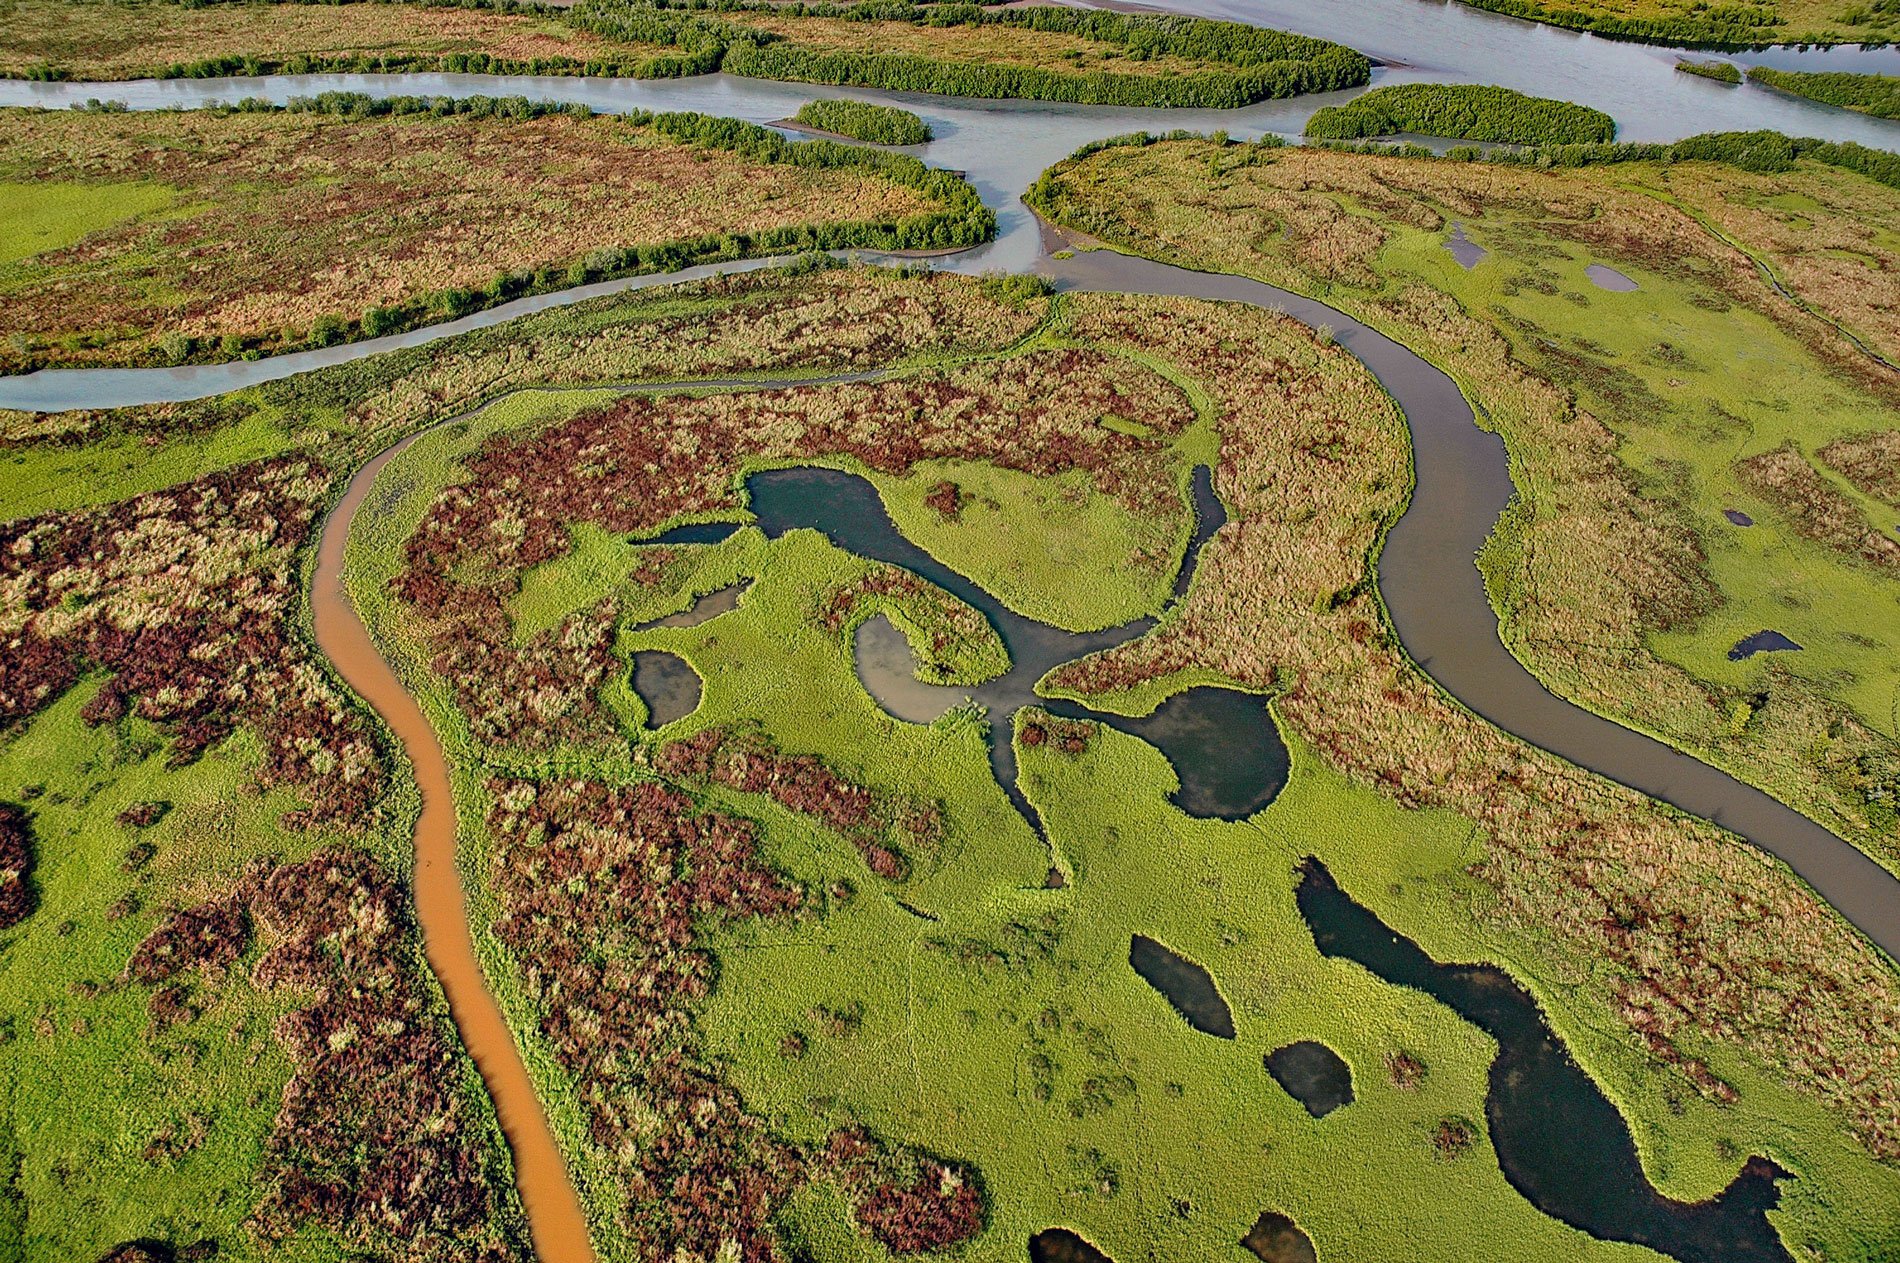
Dam Creek flows south for 5 miles (8 km) from the southwest flank of Mount Iliamna to merge with West Glacier Creek near the head of Chinitna Bay, about 62 miles (100 km) northwest of Homer and 44 miles (71 km) southeast of Port Alsworth, Alaska. The local name was first published in 1958 by the U.S. Geological Survey. The creek starts from the outlet of a cirque lake, that is fed by snowfields and remnants of a cirque glacier, in Lake Clark National Park and Preserve.
Salt marshes typically occur on tidally dominated coasts such as heads of bays, behind spits, and in fringing coastal lagoons where wave energy is very low. Tidal inundation is important for delivering sediments and nutrients to the marsh. A salt marsh is dominated by dense stands of salt-tolerant plants such as herbs, grasses, and low shrubs, but plant species diversity is relatively low. Salt marshes typically show distinct patterns of vertical zonation caused by differences in salt toleration of plants and the frequency of tidal inundation. Groups of species similarly adapted to the physical conditions form distinct communities that can be mapped.
At higher elevations in the upper marsh, tidal flooding is infrequent and freshwater has more influence than lower in the marsh, but plants can still experience dry, low-nutrient conditions. Species adapted to the lower marsh must survive high salt concentrations and frequent inundation. Salt marshes are extremely productive habitats, feeding a broad food chain of organisms from bacteria to mammals, and playing an important role in aquatic and marine food webs by exporting nutrients to coastal waters. Read more here and here. Explore more of Dam Creek here:

