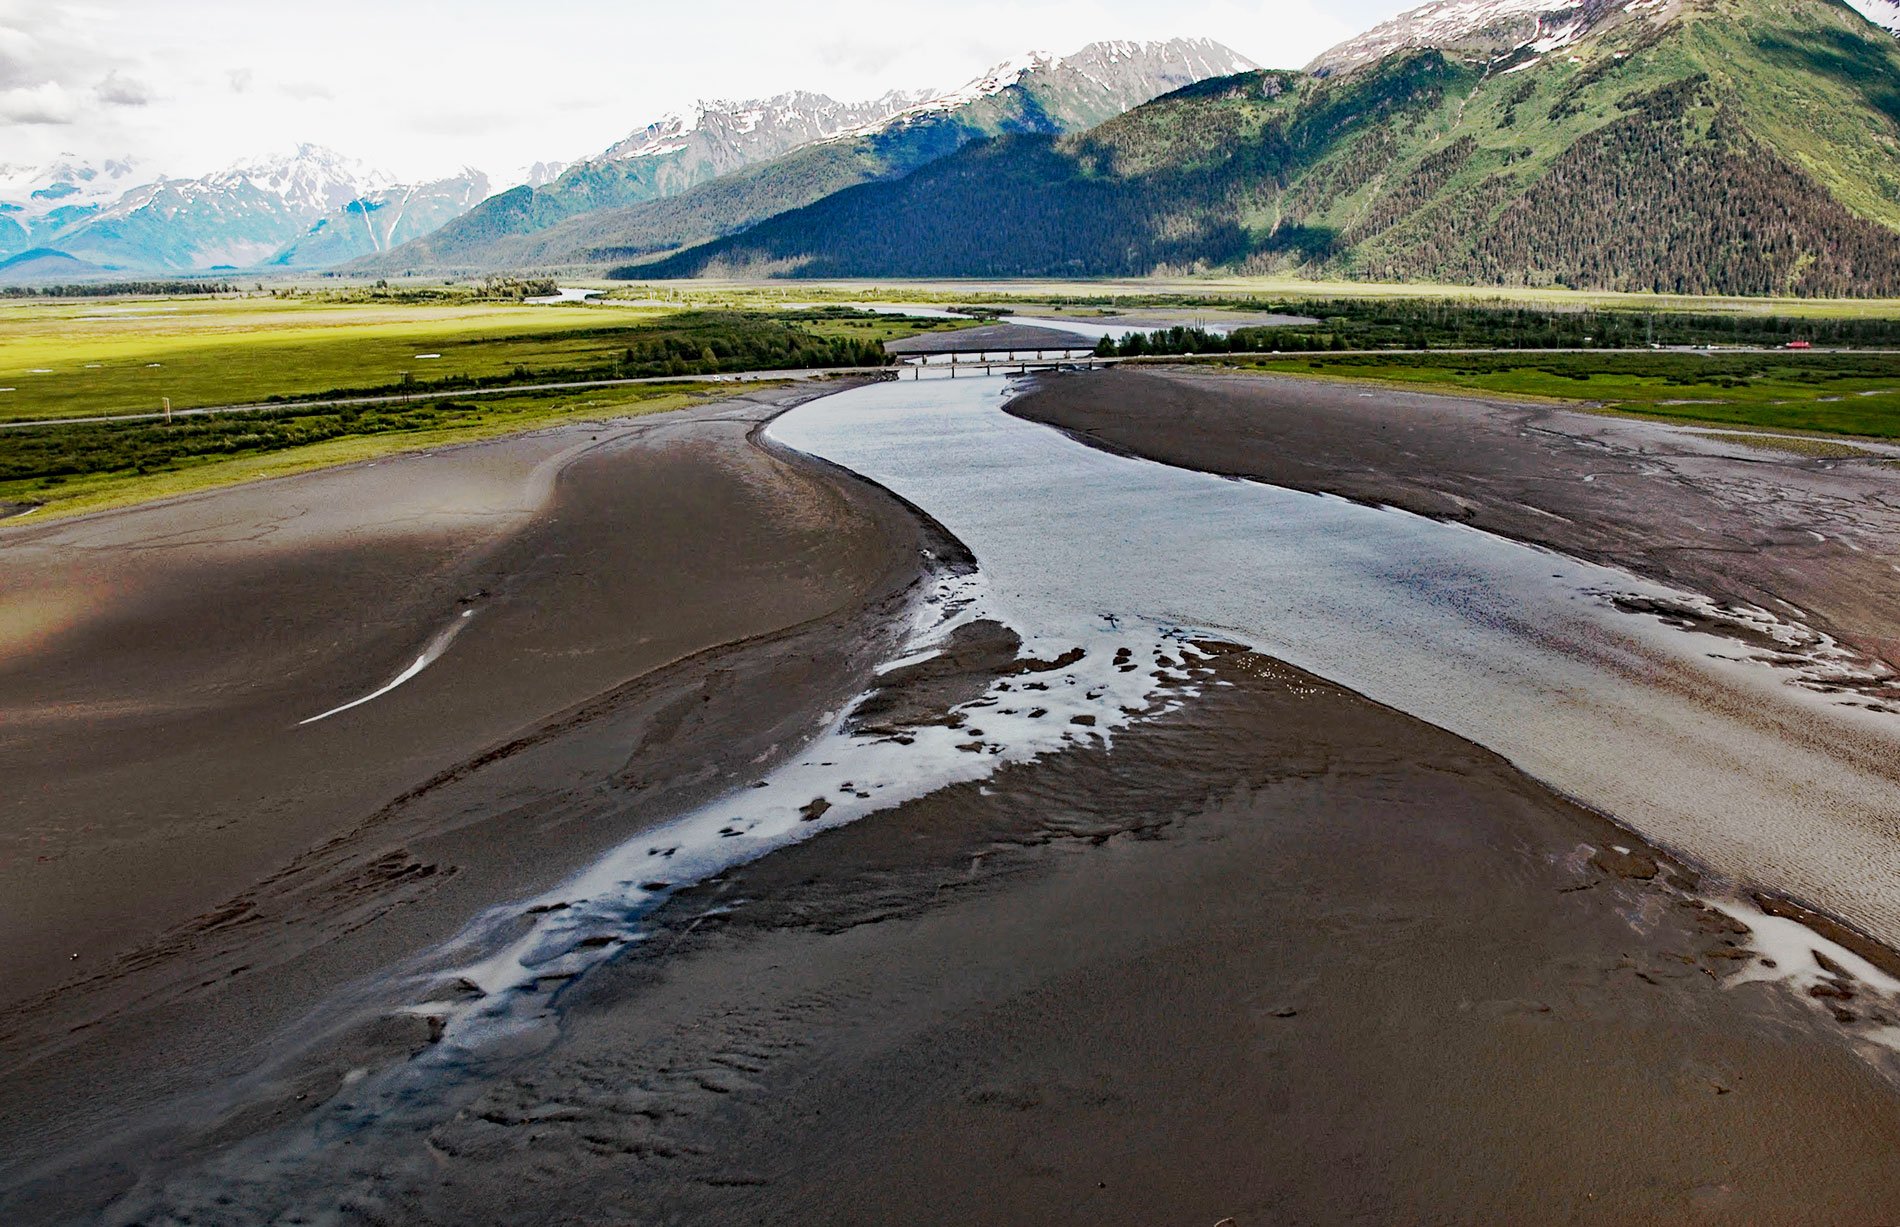
Twentymile River starts from a series of small unnamed glaciers and snowfields in the western Chugach Mountains and flows generally south for 10 miles (16 km) where it joins Glacier River, and then flows another 5 miles (8 km) southwest to Turnagain Arm, about 12 miles (19 km) northwest of Whittier and 9 miles (15 km) southeast of Girdwood, Alaska. Glacier River starts from the terminus lake of Twentymile Glacier and flows south for 1.3 miles (2 km) through a wide valley where it joins the Carmen River. The river then turns southwest and flows for 3 miles (5 km) to join with the Twentymile River. The local name was reported in 1898 by Captain Edwin Glenn of the U.S. Army.
Edwin Forbes Glenn graduated from the United States Military Academy in 1877 and was commissioned into the 25th Infantry Regiment. In 1889, Glenn commanded rescue and exploration missions in the District of Alaska. In 1890, he became a judge advocate in the Philippines where he and the soldiers under his command subjected Filipinos to torture for which he was tried and found guilty. He served in World War I in various capacities and retired as a brigadier general in 1919.
In 1898, Brigadier General Nelson A. Miles dispatched an expedition to Alaska under the command of Captain Edwin Glenn to explore and map a transportation corridor for a railroad or wagons from the ice-free ports of Seward and Portage Bay (now Whittier) to the Yukon and Tanana Rivers. Luther Sage Kelly was assigned to this expedition as chief scout and tracker. Kelly was teamed with the geologist Walter Curran Mendenhall to find a route through the Chugach Mountains. They eventually found two routes, one from Portage Bay, across the Portage Glacier, up the Twentymile to Winner Creek, then over Crow Pass to Eagle River. The other went up the Indian River to Ship Creek and then to Eagle River flats. Read more here and here. Explore more of Twentymile River here:

