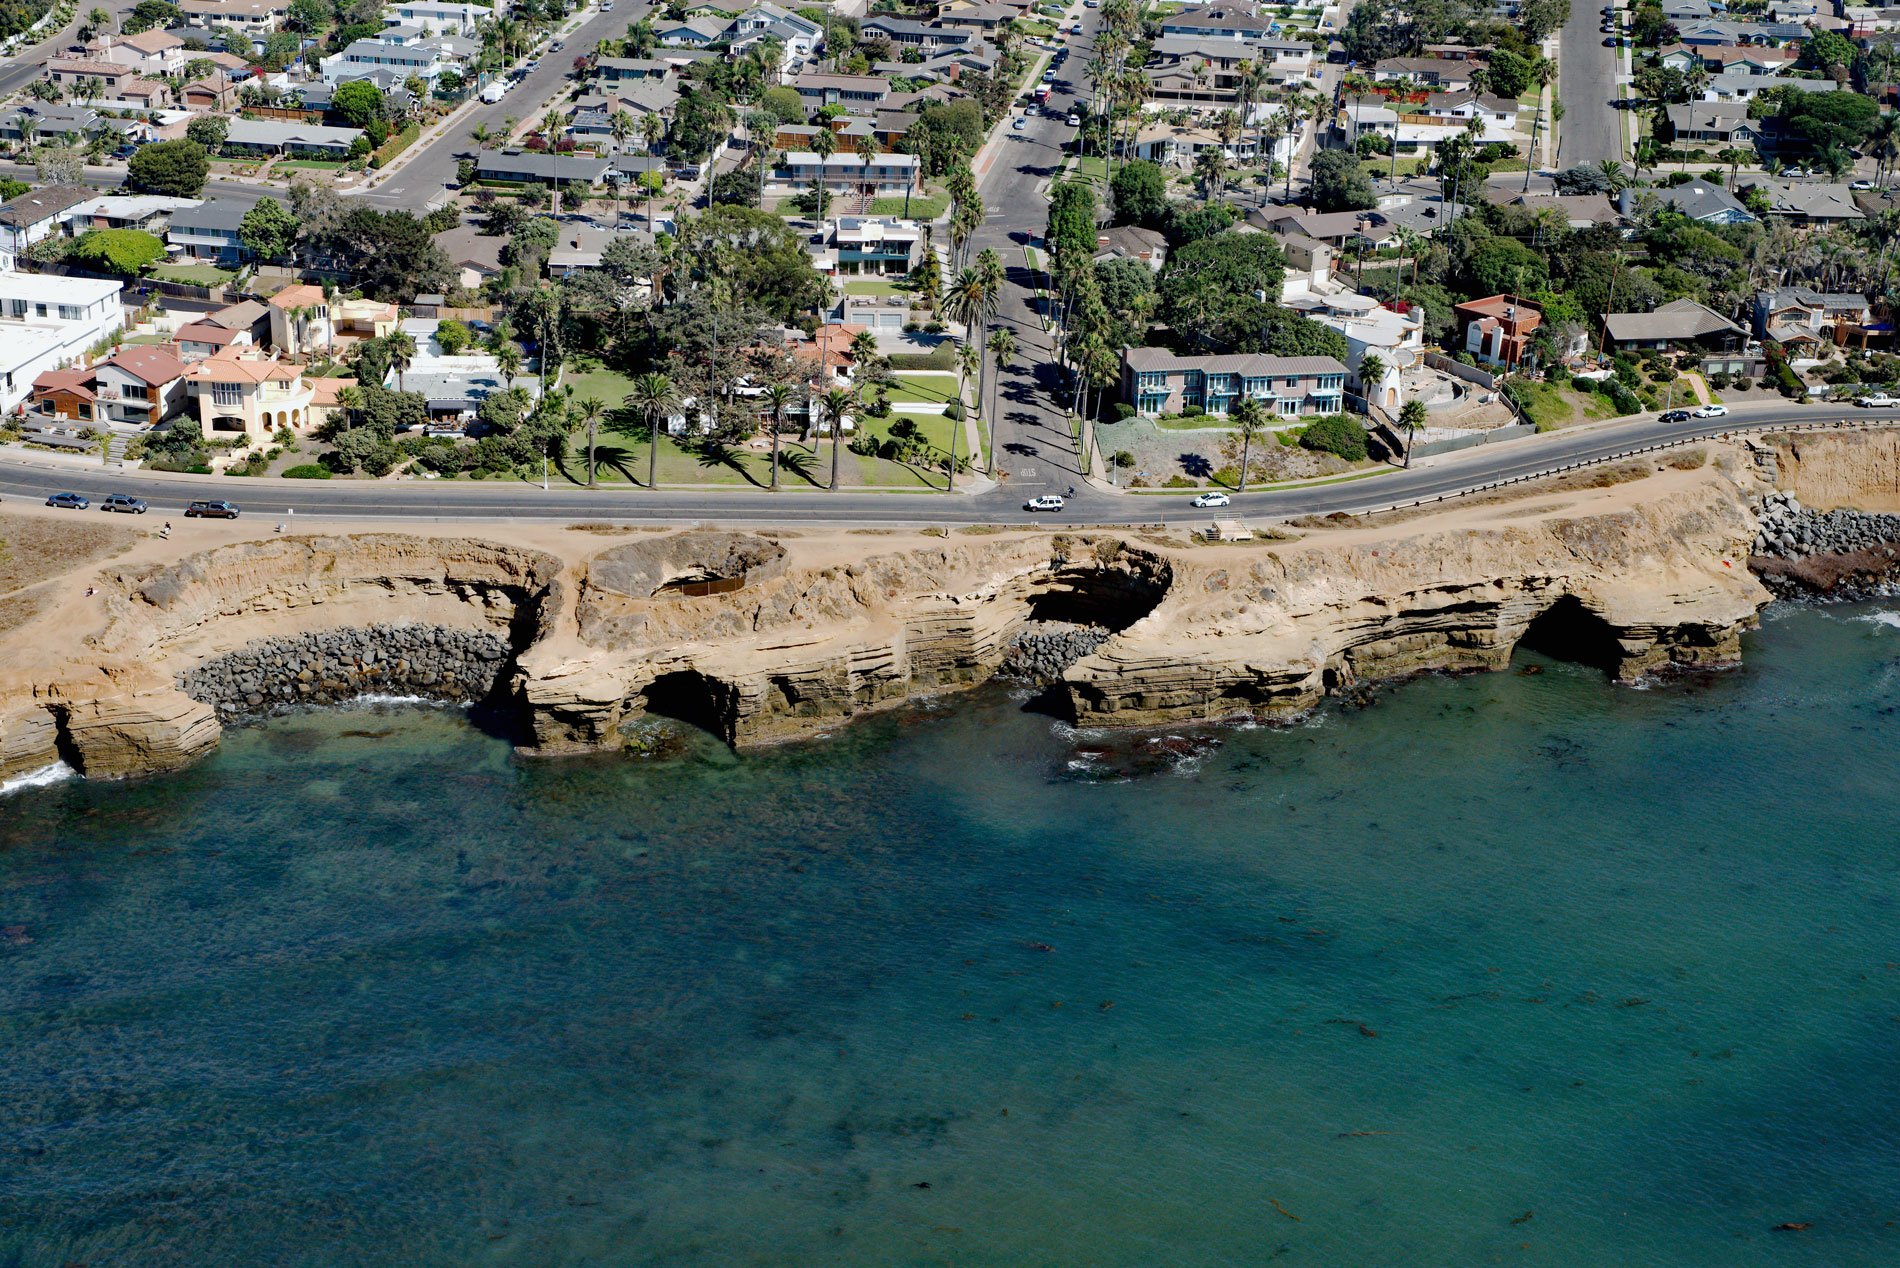
Sunset Cliffs is a neighborhood adjacent to the Pacific Ocean on the western edge of Point Loma, about 7.5 miles (12 km) south of La Jolla and 5 miles (8 km) west of San Diego, California. The area is named for the sheer cliffs which border the ocean and historically was a place to view the setting sun. Sunset Cliffs Natural Park is a 68-acre (28 ha) coastal strip between the ocean and Sunset Cliffs Boulevard connected to the 640-acre (260 ha) Point Loma Reserve. The park was dedicated in 1983 and includes carved coastal bluffs, arches, and sea caves.
American Kumeyaay Indians historically travel along Sunset Cliffs to gather seafood from the intertidal beaches below the cliffs. They also gathered various terrestrial plants in the area. During the 1915 Panama–California Exposition, Albert Spalding developed a section of the cliffs by constructing bridges, trails, benches, and a stairway to the ocean. Spalding called his estate Sunset Cliffs Park, which then lent its name to the neighborhood. In 1925, John P. Mills bought the property and surrounding area and developed it into a residential neighborhood, and later the City of San Diego acquired the Spalding property from Mills and turned the coastal strip into a city park.
The Sunset Cliffs region is pockmarked with a dense series of caves. Above the cliffs is a strikingly circular hole or littoral sink, also called a punchbowl, formed by a collapsed sea cave. The hole is about 40 feet (12 m) deep and leads to a short sea cave with a single seaward entrance. The cave is in thin-bedded marine siltstones and sandstones known as the Point Loma Formation. Further north, a larger littoral sink known as the Devil’s Pot was a tourist attraction for many years and is pictured on a 1910 hand-colored postcard; however, it has since eroded away. Read more here and here. Explore more of Sunset Cliffs here:

