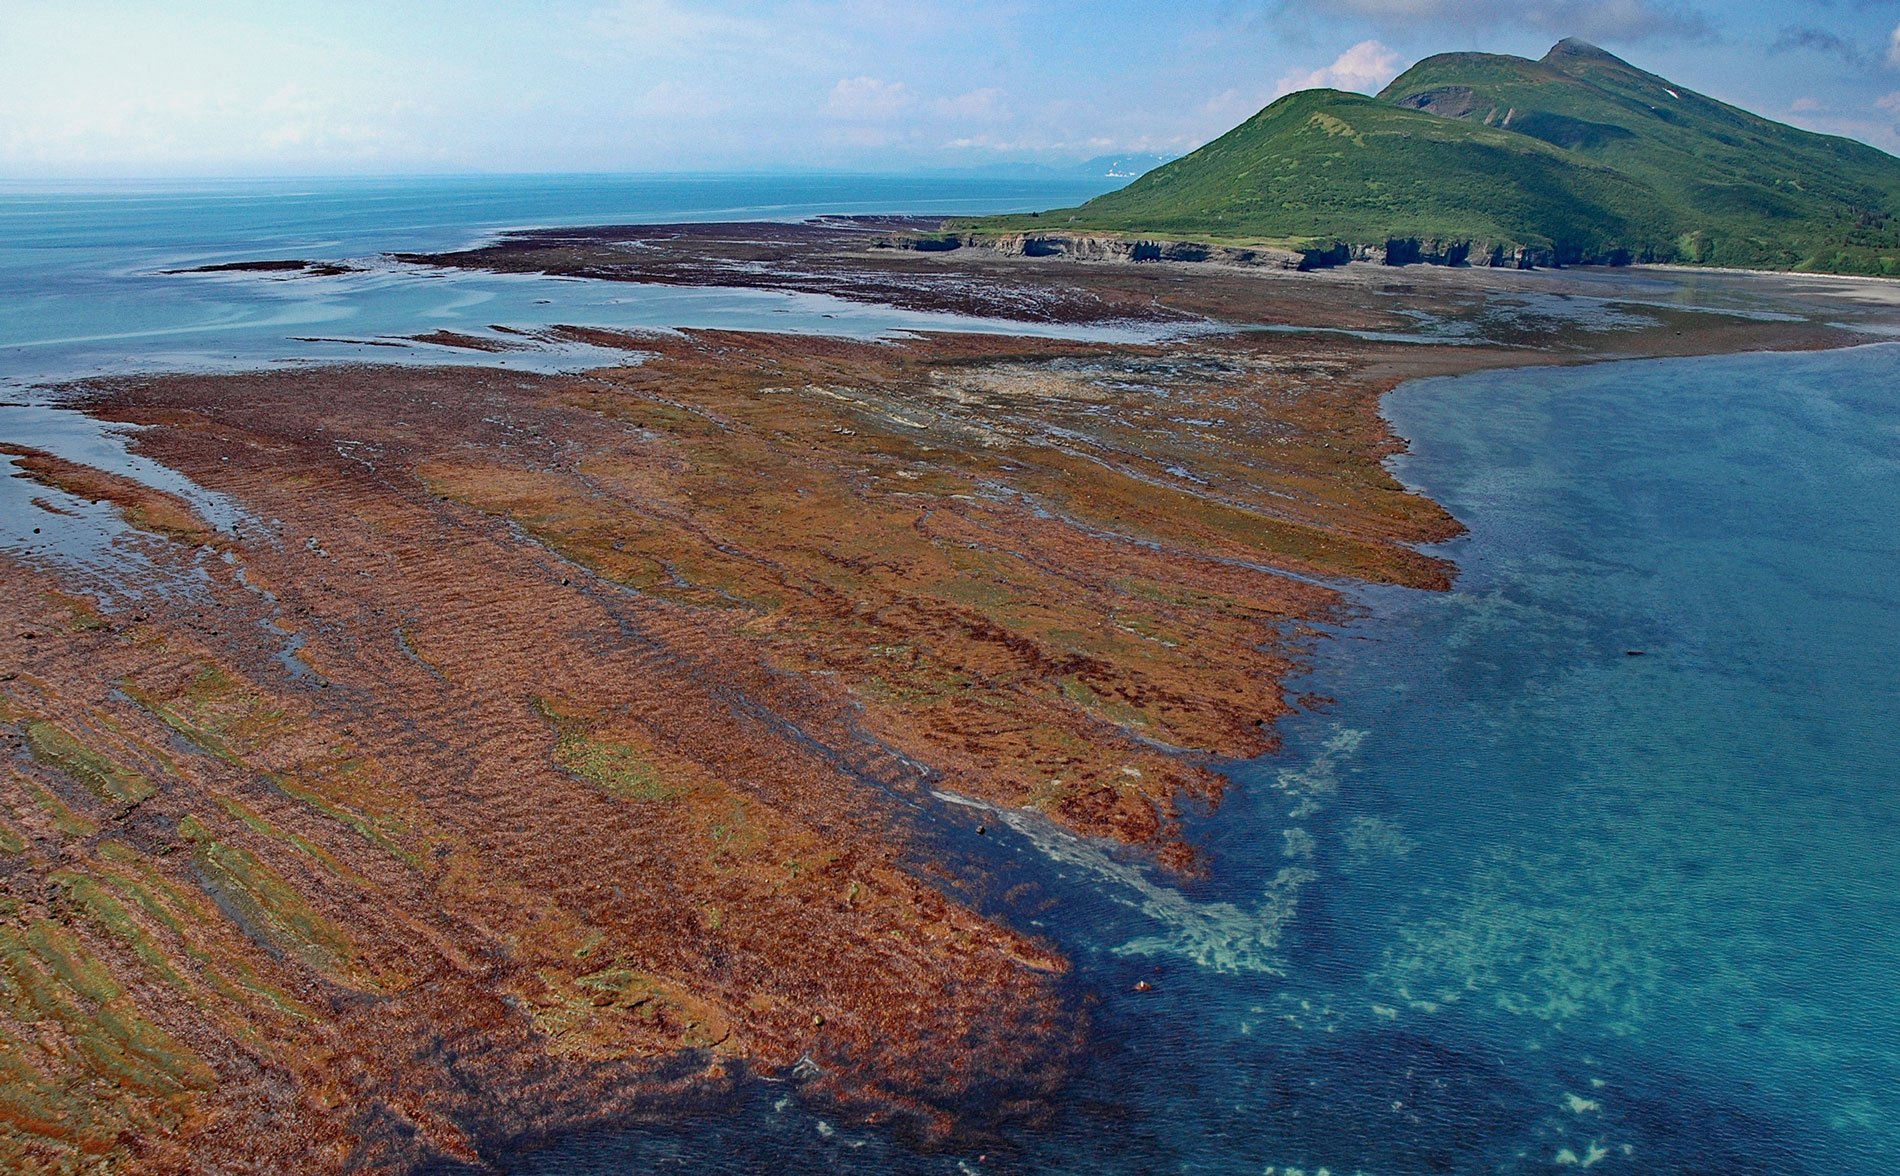
Tignagvik Point is a headland on the western shore of Cook Inlet, at the northern point of entrance to Kamishak Bay, about 80 miles (129 km) west-southwest of Homer and 47 miles (76 km) southeast of Iliamna, Alaska. The Alutiiq name was first published in 1915 by the U.S. Coast and Geodetic Survey. Rocky Cove is on the north side of Tignagvik Point and forms a shallow embayment about 1 mile (1.6 km) across. The cove was named in 1903 by G.C. Martin of the U.S. Geological Survey.
Waves erode coastal rocks and often create nearly level shore platforms. The depth of the platforms is typically limited by the range of tide and depth of wave energy. Surface waves are generated by wind, and stronger winds create larger and more energetic waves. While large waves can occur any time of year they are more frequent in the winter. Wave energy decreases with depth, and at a depth of about 10 m (33 feet), most wave energy is completely attenuated, so platforms are rarely formed at greater depths. Kamishak Bay in southern Cook Inlet has extreme tides of nearly 30 feet (10 m) and extensive wave-cut platforms are often visible at low tide.
While shore platforms represent an erosional feature, at time scales of most benthic marine algae and animals (months to years) they represent a stable habitat that supports prolific algal growth. Algal biomass reaches a peak in late summer and then decreases as waves generated by winter storms damage or destroy the plants. Winter ice floes carried by Cook Inlet currents scour away all but the most persistent plants and animals from the rock often leaving a bare surface for new recruitment of algal spores and animal larvae in the spring. Read more here and here. Explore more of Tignagvik Point here:

