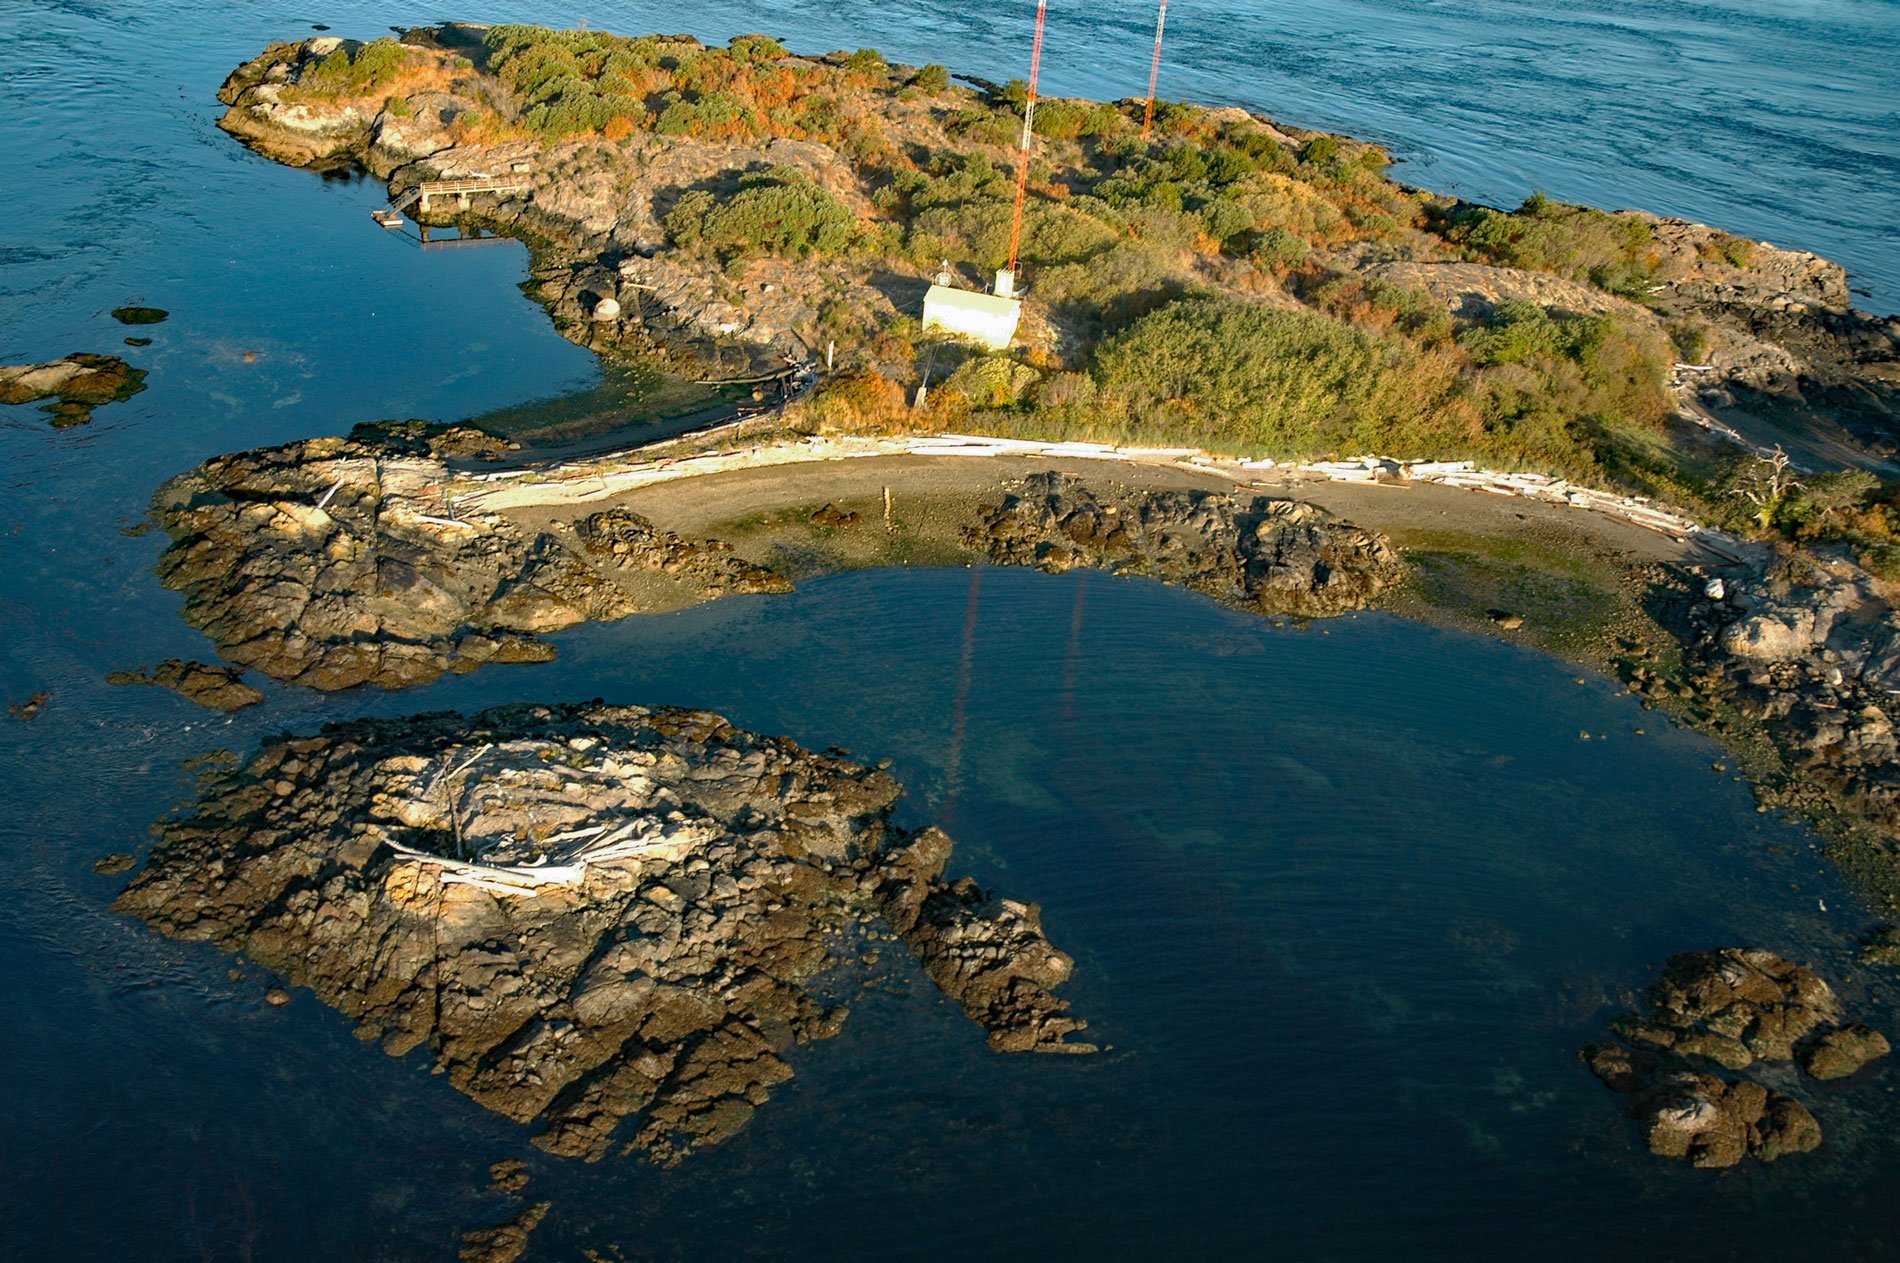
Strongtide Islet is part of the Chatham Islands that are off the southern coast of Vancouver Island, about 5.4 miles (8.7 km) east-northeast of Victoria and 2.5 miles (4 km) northeast of Oak Bay, British Columbia. The Chatham Islands were given their current name in 1846 by surveyors in honor of HMS Chatham, the escort ship of HMS Discovery, that carried 18th century British explorer Captain George Vancouver on his voyage to chart the coastline of British Columbia between 1792 and 1794.
The two largest islands are the namesake of the group that also includes Alpha, Griffin, Strongtide, and Vantreight Islands. All the islands except for the Alpha Islets Ecological Reserve are in Chatham Islands Indian Reserve No. 4 and under the control of the Songhees First Nation. Between the early 1700s and the end of the 1800s, the British Crown entered into treaties with Indigenous Peoples in its North American colonies to support peaceful economic and military relations. The islands are treaty lands; however, the Songhees First Nation did not forfeit their rights to the foreshore and aquatic lands to the Crown.
Victoria and southern Vancouver Island have been served by various radio stations broadcasting at a frequency of 900 AM since 1945. In 1963, transmitting facilities were moved to Strongtide Islet under a long-term lease agreement with the Songhees Nation. This agreement allowed for the continued use of the site and provided the tribe with a revenue source. In 2014, the original power cable to the island was severed by boaters dragging an anchor, leaving the island and some adjacent islands without power. In 2015, a secondary generator was installed to provide power for the tower lights and in 2015, a new cable was laid to serve the transmitter site and other island facilities. Read more here and here. Explore more of Strongtide Islet here:

