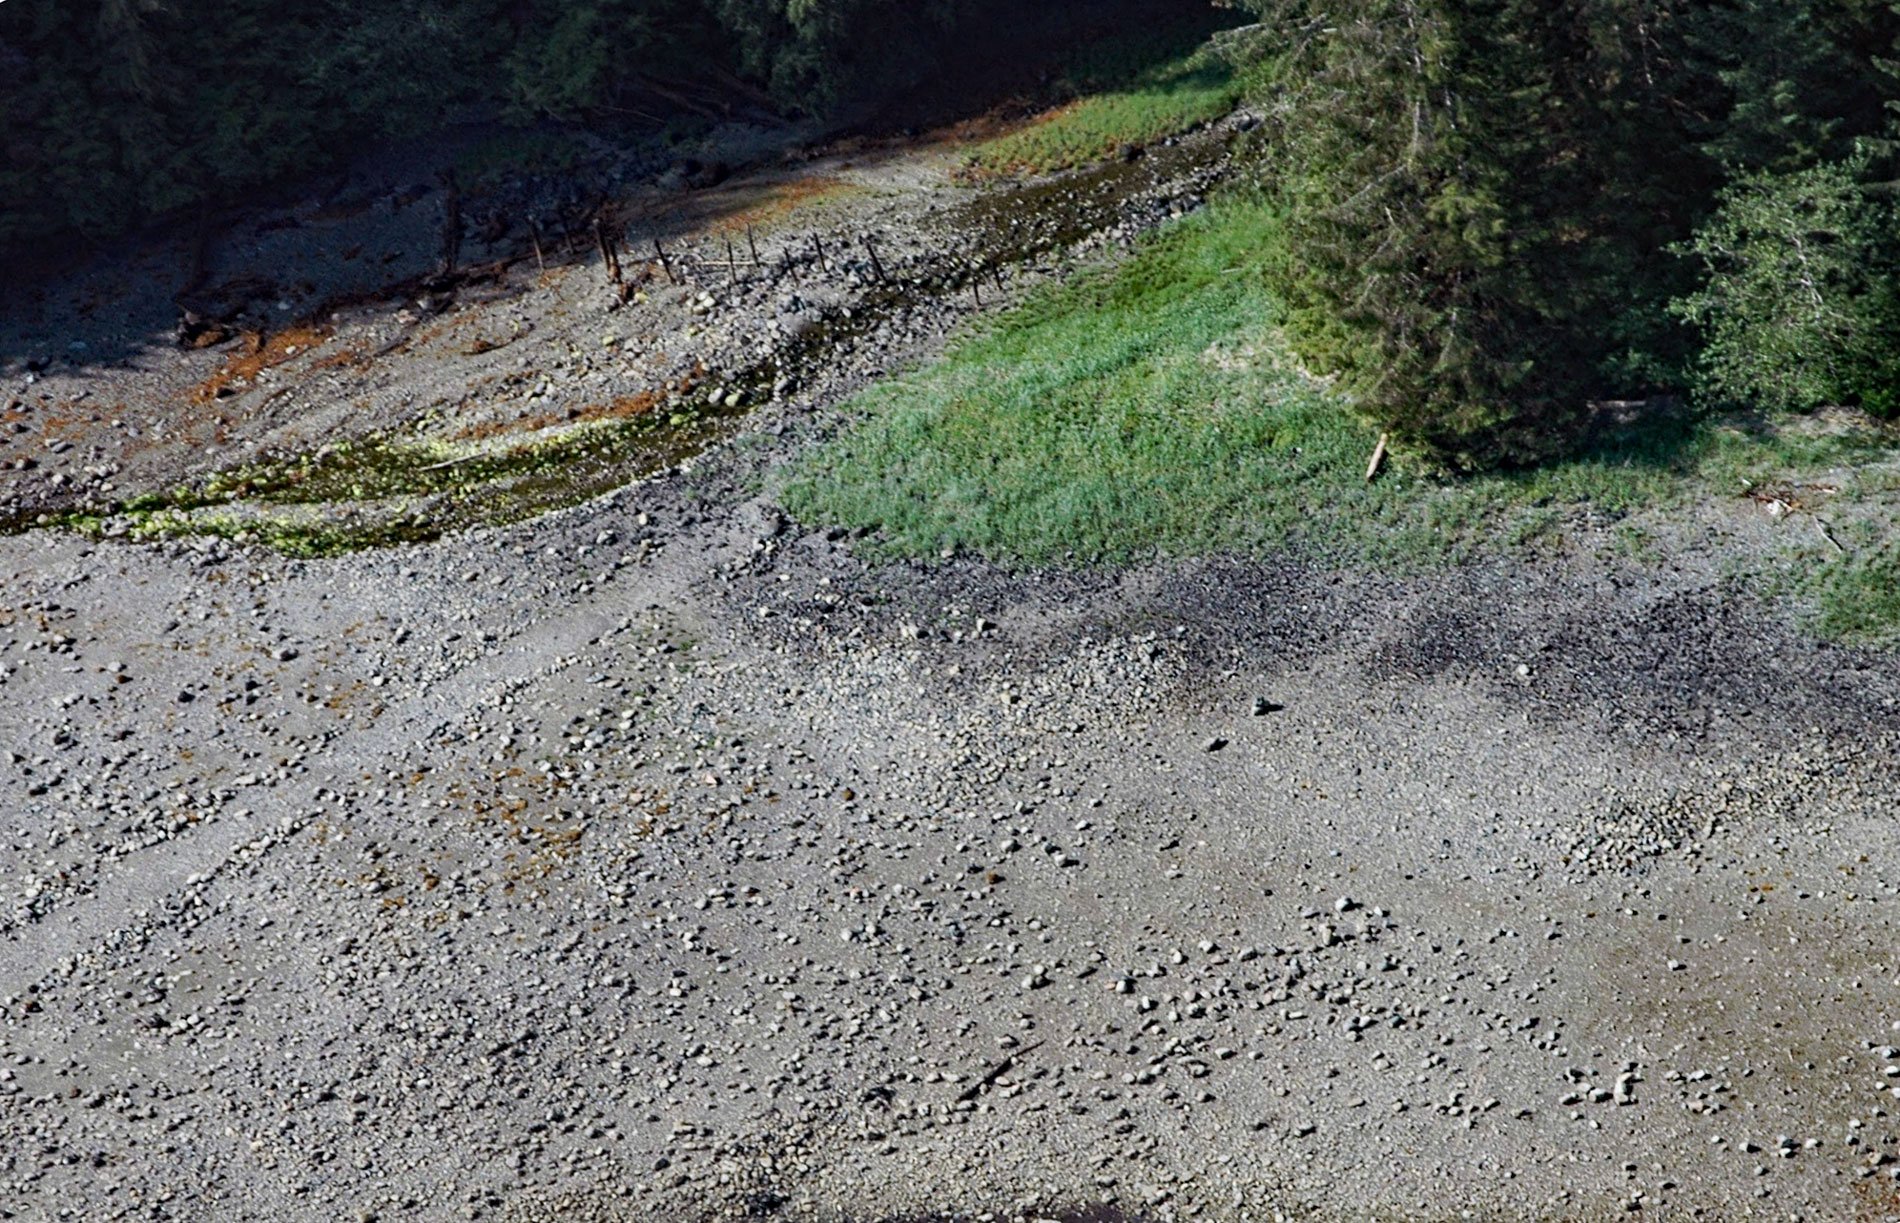
Cannery Cove is on the southeastern shore and near the head of North Arm Moira Sound, about 28 miles (45 km) east-southeast of Hydaburg and 25 miles (40 km) southwest of Ketchikan, Alaska. The local name for the cove was reported in 1905 by Edmund F. Dickins who commanded the U.S. Coast and Geodetic Survey steamer Thomas R. Gedney. North Arm Moira Sound is a fjord that extends northwest for 4 miles (6.5 km) from Moira Sound on the southeast coast of Prince of Wales Island. Moira Sound was named in 1793 by Captain George Vancouver after Sir John Rawdon, Earl of Moira, from Moira, Ireland.
In 1912, the Starr brothers of Portland Oregon organized the Starr-Collinson Packing Company that built a cannery in North Arm Moira Sound, on a beach at the mouth of a creek traditionally used by Tlingit and Haida people for landing canoes. In 1917, World War I created a demand throughout the world for canned foods resulting in a considerable increase in the number of new canneries in Alaska. Nine new canneries were built in Southeast Alaska including the Lane & Williams facility in Moira Sound. In 1926, there were also four floating canneries operating in Moira Sound. The Starr-Collinson cannery burned in 1929, and the Lane & Williams cannery closed in 1936.
In 1915, a small gold prospect called the Cymru Mine was developed at Mineral Lake on the north shore near the head of North Arm Moira Sound. The working consisted of an inclined shaft with horizontal drifts at 30 feet (9 m) and 90 feet (27 m). The lower drift extended southeastward along the ore vein for 96 feet (29 m). The workings on the upper drift were more extensive. The mine was equipped with several buildings and a substantial wharf which was connected with the mine by an aerial tramway. The ore was hoisted through the shaft and then transported downhill to ore bunkers at tidewater. Read more here and here. Explore more of Cannery Cove and North Arm Moira Sound here:

