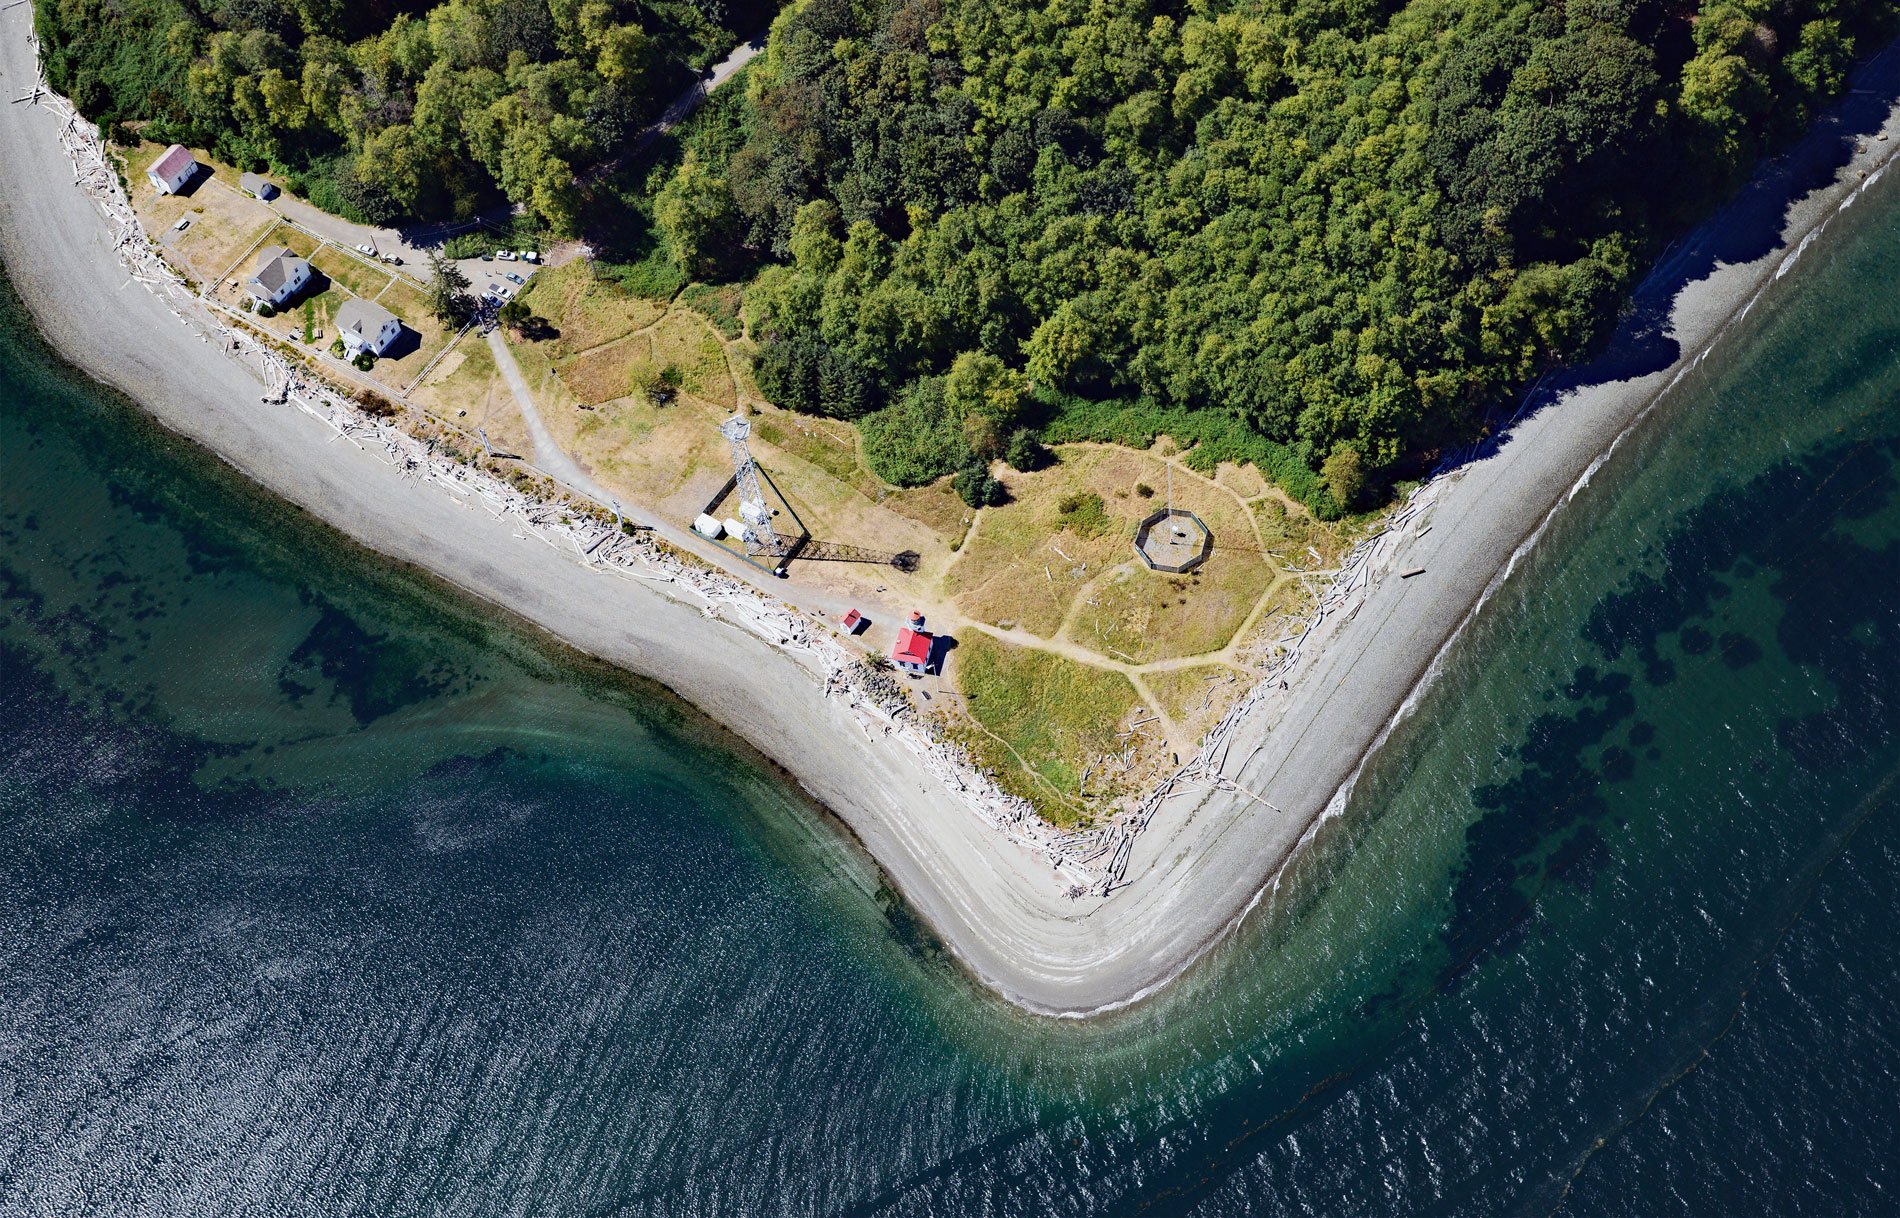
Point Robinson is the eastern point of Maury Island in Puget Sound and the site of a historic lighthouse, about 15 miles (24 km) south of Seattle and 10 miles (16 km) north-northeast of Tacoma, Washington. The point was named in 1841 by the United States Exploring Expedition in honor of John Robinson who served as quartermaster under Lieutenant Charles Wilkes from 1838-1842. Maury Island was also named by the expedition in honor of William L. Maury. Maury Island is tied to Vashon Island by a narrow tidal isthmus that was filled in 1913 to make a dry portage and is now paved with an all-weather road. The topography of Vashon and Maury islands primarily reflects the sequence of glaciations during the Late Pleistocene of the Puget Lowland. The ice originated in the mountains of British Columbia and a lobe of the Cordilleran ice sheet repeatedly advanced down the Puget trough filling the lowland between the Cascade Range to the east and the Olympic Mountains to the west. During glacial advances, metamorphic rocks were carried southward by ice and meltwater and were subsequently deposited as glacial till. The eastern tip of Maury Island is formed by these Vashon glaciation deposits, as well as older till deposits and sediments from more recent landslides.
Early humans arrived in Puget Sound shortly after the Vashon Glacier retreated about 11,000 to 12,500 years ago. These nomadic hunters seemed to have peaked and subsided in the region by about 8,000 years ago probably because of the loss of their prey such as mammoths, mastodons, and ground sloths. They were followed by the Marpole people who around 5,000 years ago represented a cultural shift from hunting game to fishing and gathering. About 3,500 years ago, a Coast Salish culture emerged that focused more on marine resources and it grew to dominate the region by about 1,500 years ago. The estimated human population on Vashon Island before the arrival of Europeans was about 650. In 1838, the Hudson’s Bay Company estimated the population to be roughly 315 consisting of 100 males, 89 females, 56 boys, 69 girls, and 1 slave, with ten guns and twenty-eight canoes. In 1853, the Washington Territory Indian agent for Puget Sound estimated the population at 40. In 1792, Captain George Vancouver visited Puget Sound and made the first chart showing the general outline of Vashon Island. In 1842, Wilkes drew a map with considerably more detail that shows the separation between Vashon and Maury islands and the depth soundings of the surrounding waters.
In 1879, the U.S. Lighthouse Board recommended that a steam-powered fog whistle be constructed at Point Robinson to serve vessel traffic to and from Tacoma which was the prospective terminus of the Northern Pacific Railroad. Development of a navigational aid at Point Robinson began in 1884 when 24 acres (10 ha) of private land was purchased. The fog signal station was opened on July 1, 1885. The original coal-burning boiler and steam whistle came from Oregon’s Point Adams Light. A light keeper’s house was built nearby, and in 1907, a second keeper’s residence was added. The current lighthouse, featuring an octagonal tower 38 feet (12 m) high was completed in 1915. This is identical to the lighthouse at Alki Point near Seattle. The lighthouse has been fully automated since 1978. In 1989, the U.S. Coast Guard constructed a tower 100 feet (30 m) high for radar and radio to aid Puget Sound Vessel Traffic Service, and a differential global positioning system was added to the facility in the early 1990s. Today, Point Robinson is a shoreline park and historical and marine conservancy of 10 acres (4 ha). The property conserves an extensive sandy beach shoreline that wraps around the point, a saltwater marsh, and woodlands. Point Robinson Stewards has fully restored the two keepers’ quarters on the property for use as rentals. Read more here and here. Explore more of Point Robinson and Maury Island here:

