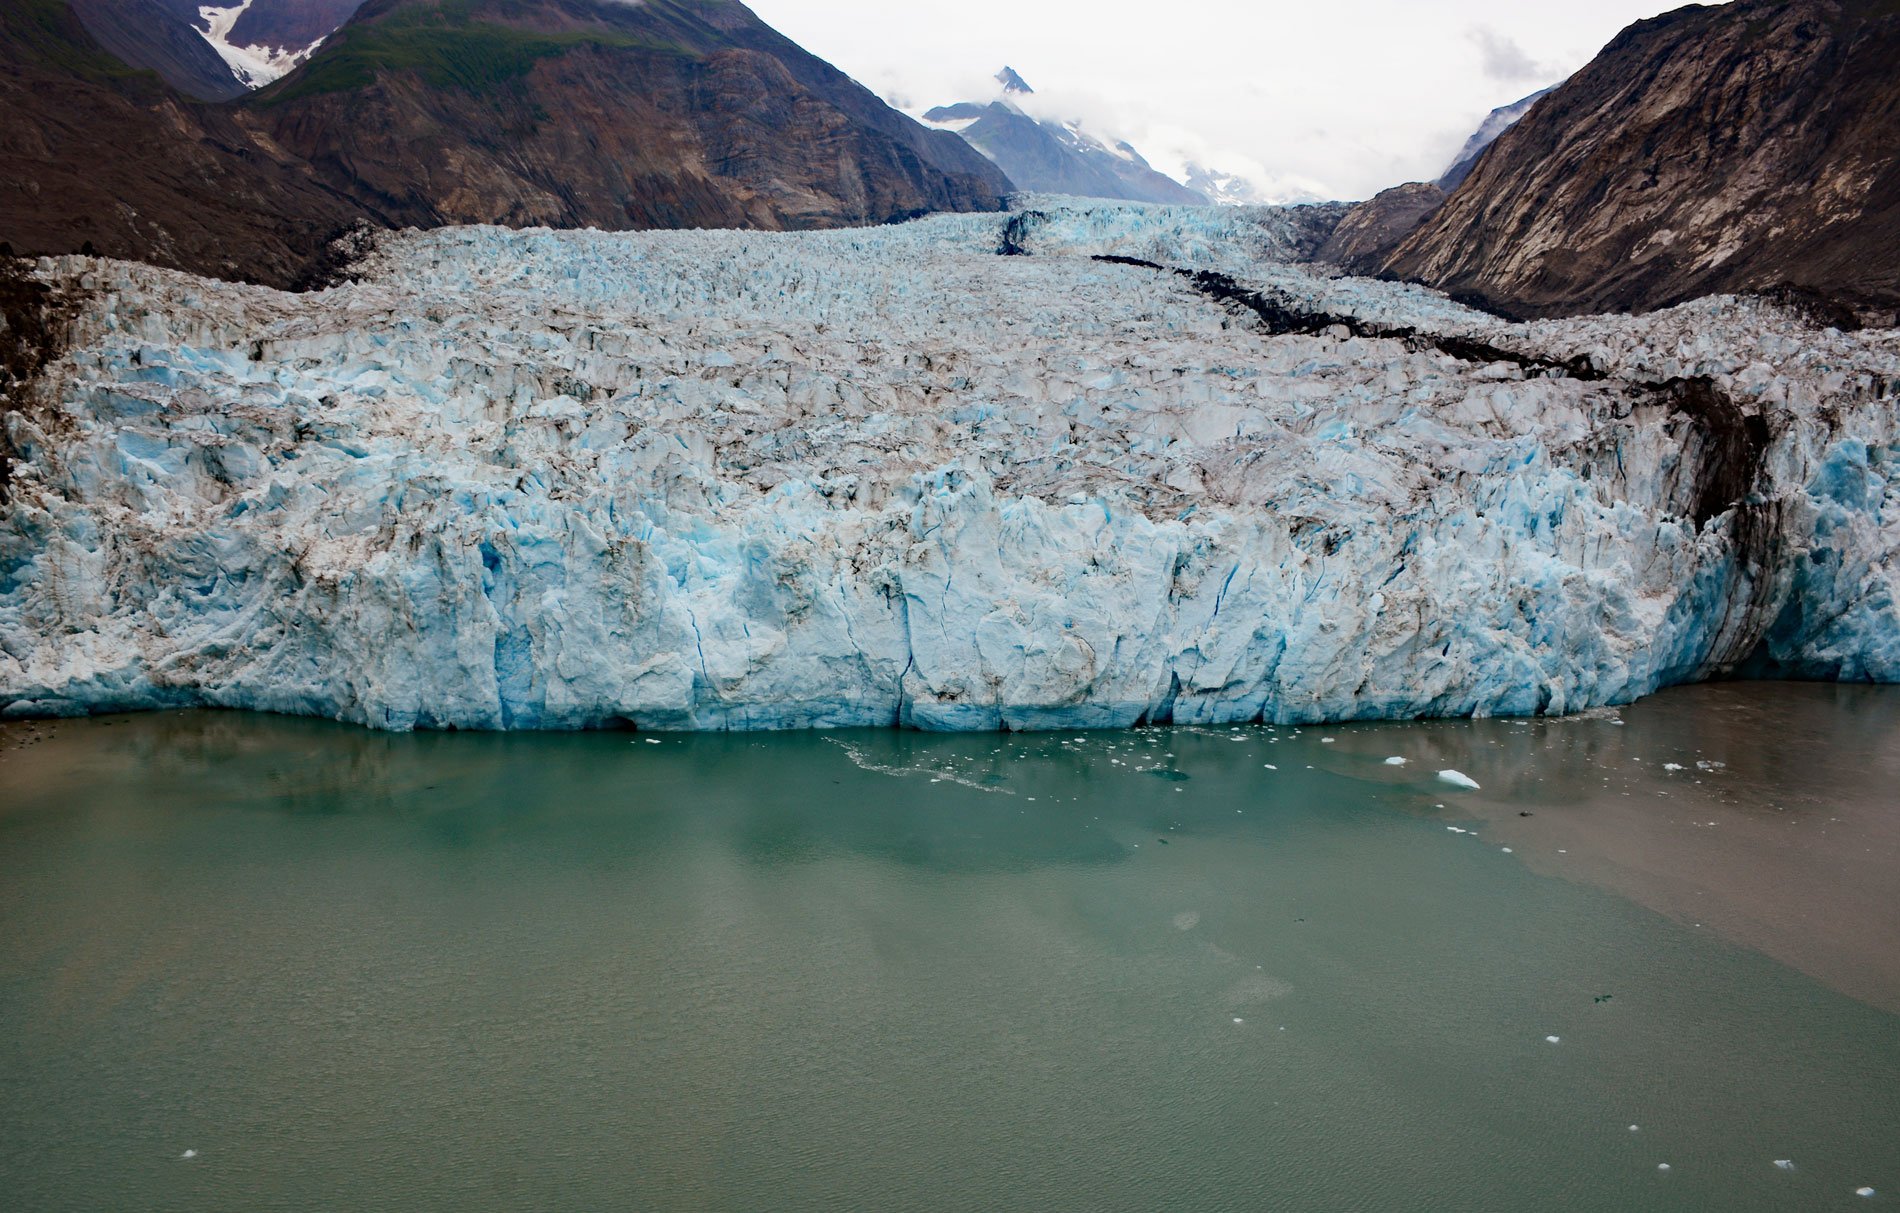
McBride Glacier starts from a series of cirques at elevations near 5500 feet (1676 m) on the southern flank of the Takhinsha Mountains in Glacier Bay National Park and Preserve and flows generally south for roughly 10 miles (16 km) to McBride Inlet which connects to Muir Inlet, about 46 miles (74 km) north-northwest of Gustavus and 25 miles (40 km) southwest of Haines, Alaska. McBride Inlet was recently exposed by the receding terminus of the glacier and is now about 4 miles (6.5 km) long. The glacier was named in 1890 by Harry F. Reid for Herbert McBride a student and member of his survey team from Case School of Applied Science. The retreat of McBride Glacier and the general thinning of all the glaciers in the area has revealed some of the underlying bedrock which represents a heterogeneous suite of igneous intrusions that developed during the Cretaceous consisting mostly of granodiorite, biotite, and some quartz monzonite. There are also some younger plutons from the Oligocene and Eocene consisting of granodiorite, granite, and tonalite. Exposures of carbonate rocks from the Permian age also occur and these consist mostly of limestone.
Morse, Muir, Riggs, and Casement glaciers once terminated in tidewater but have all retreated and are now grounded. McBride Glacier is the last of the great Muir Inlet ice streams to reach tidewater and is presently about 0.5 miles (0.8 km) wide and less than 10 miles (16 km) long and rapidly retreating. Its ice face is approximately 200 feet (61 m) high above the waterline and currently extends to a depth of 270 feet (82 m). Ice flow rates have not been measured, but are estimated to be about 3,000 feet (915 m) per year. McBride Glacier has been steadily thinning and retreating by ice calving since the 1960s after its separation from Muir Glacier. Submarine moraines mark several positions in McBride Inlet where the ice margin was in a stable position for several years. Over the last 5 years, retreat rates have increased with occasional massive ice-calving events releasing enough large icebergs to fill all of McBride Inlet. The rate of retreat accelerated in 1999 when the ice margin receded from water depths of 60 feet (18 m) at the edge of a proglacial basin with depths of 120 feet (36 m) to 140 feet (43 m) depth, and into a deeper basin where depths were measured to be greater than 250 feet (76 m).
Glaciers in Glacier Bay National Park and Preserve are maintained at relatively low latitudes by high rates of precipitation caused by the orographic lift of maritime airmasses in the mountains bordering the Gulf of Alaska. Like the McBride, Muir Glacier is also sourced from the icefields of the Takhinsha Mountains. The general retreat of glaciers began at the end of the Little Ice Age about 1750 AD, and subsequently opened an extensive fjord system in less than 250 years. Glacial retreat in Glacier Bay is well documented beginning with the observations of Captain George Vancouver in 1794. Muir Inlet was named in 1883 by the U.S. Coast and Geodetic Survey for John Muir who first visited this area with Tlingit guides in 1879. He was the first in a long line of distinguished scientists to visit and bring attention to this remarkable area. Largely due to his enthusiastic writings, Glacier Bay became a popular tourist attraction, as well as the focus of scientific inquiries, during the late 1880s and 1890s. In 1899, Muir Glacier began a rapid retreat. At that time, and until 1979, the glacier flowed at about 6000 feet (1830 m) per year or about 16 feet (5 m) per day. In 1993, the glacier became grounded and today, the terminus is about 1 mile (1.6 km) inland from the head of the fjord and relatively stable; however, the ice is continually losing mass as evidenced by thinning along the glacier margins. Read more here and here. Explore more of McBride Glacier and Muir Inlet here:

