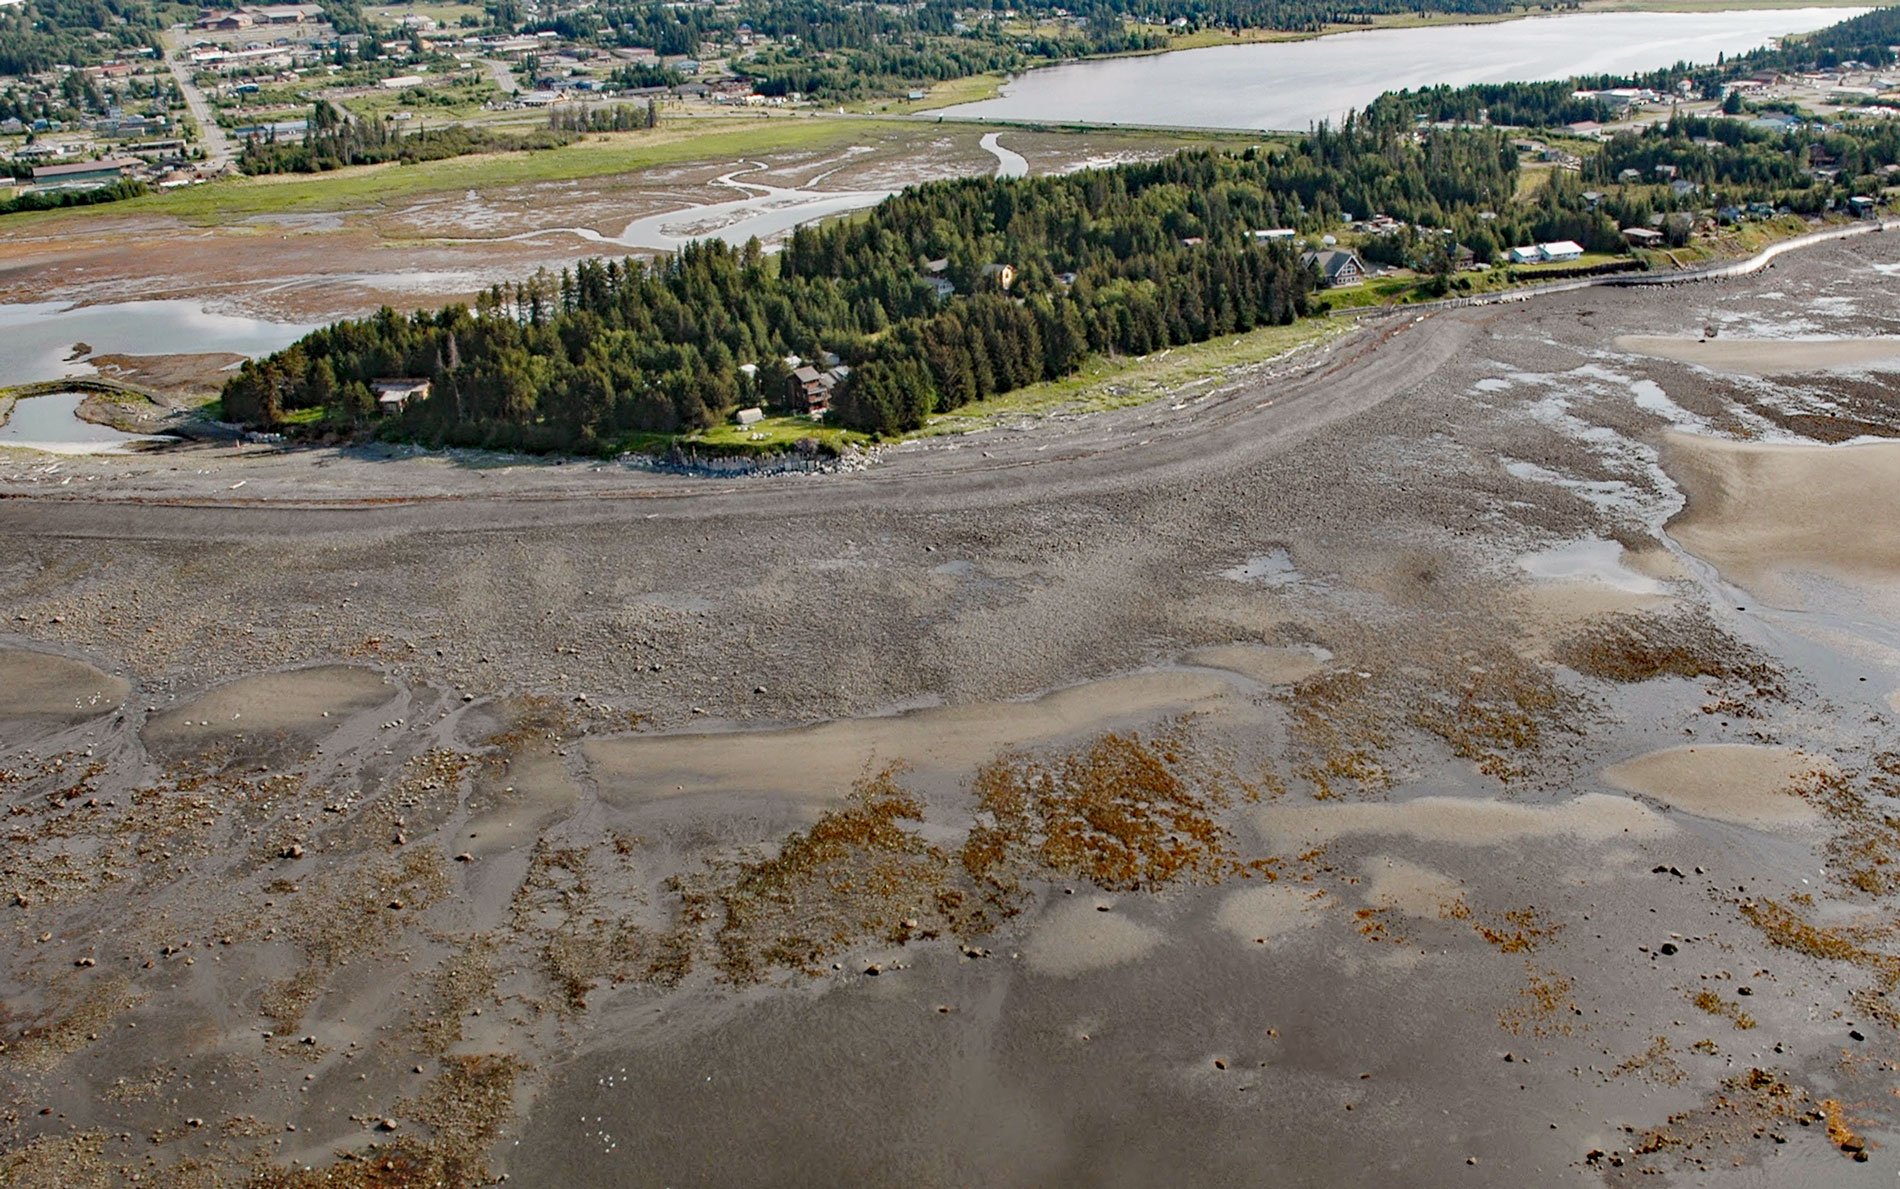
Munson Point is a peninsula formed by an ancient lateral moraine located on the northern shore of Kachemak Bay between Beluga Slough to the west and Mariner Lagoon to the east, about 15 miles (24 km) northeast of Seldovia and 1 mile (1.6 km) south of Homer, Alaska. The point is named after Oscar Munson who came to Alaska from Malmöhus, Sweden in 1903 to prospect during the Nome Gold Rush. In 1910, he married Nellie ‘Allie’ Swaghun, an Iñupiaq from King Island who was living in Nome, and they moved to Homer in 1926. In 1929, Munson was the U.S. mail carrier for Homer and had homesteaded the point with his wife and 5 children. When Oscar and Nellie died in the early 1930s, the children were sent to the Jesse Lee Home for Children in Seward and the homestead was foreclosed for property taxes and subdivided into residential lots. The point was the location of a navigational beacon until about 1961, marking the entrance to Beluga Slough which served as an early small boat harbor for Homer.
The Cook Inlet side of Munson Point, and particularly the 0.5 miles (0.8 km) of shoreline to the east, is prone to severe wave erosion at high tides. Shoreline erosion rates were estimated from historical air photos during the interval from 1951 to 2003, and average about 3.5 feet (1 m) per year. These rates presumably accelerated after the 1964 Good Friday earthquake that caused local subsidence of as much as 6 feet (2 m). This lowered the base of coastal bluffs, making them more prone to wave attack. Waves during periods of high tides undercut the sea cliffs, causing episodic slumping of massive volumes of sediment in the intertidal zone. At Munson Point, the nearshore sediments are transported southeastward and eventually contribute to the construction and maintenance of the Homer Spit. Erosion severely affects the waterfront properties of the Munson subdivision and in 2003, the City of Homer constructed a seawall to protect these properties from erosion.
The effect of seawalls on beaches has been a topic of considerable research and controversy for many years. Beaches have been reputed to respond to wave-seawall interactions in many different ways, including the formation of standing waves, current scoured troughs, and loss of beach sediment. Processes that contribute to these changes include wave reflection from the seawall, acceleration of alongshore currents, and increased sediment mobilization. In 2003, an array of cameras was installed on a tower constructed at Munson Point to measure the movement of beach sediments adjacent to the seawall. In 2003 and 2004, high-resolution surveys of the low tide shoreline were conducted to measure the annual topographic differences. The data suggests that beach sediments moved the fastest during intense late fall and winter storms, with sustained rates averaging 5 feet (1.41 m) per day. Conversely, the slowest movement of sediments occurred during the spring and summer, when rates averaged only 0.5 feet (0.11 m) per day. Read more here and here. Explore more of Munson Point and Kachemak Bay here:

