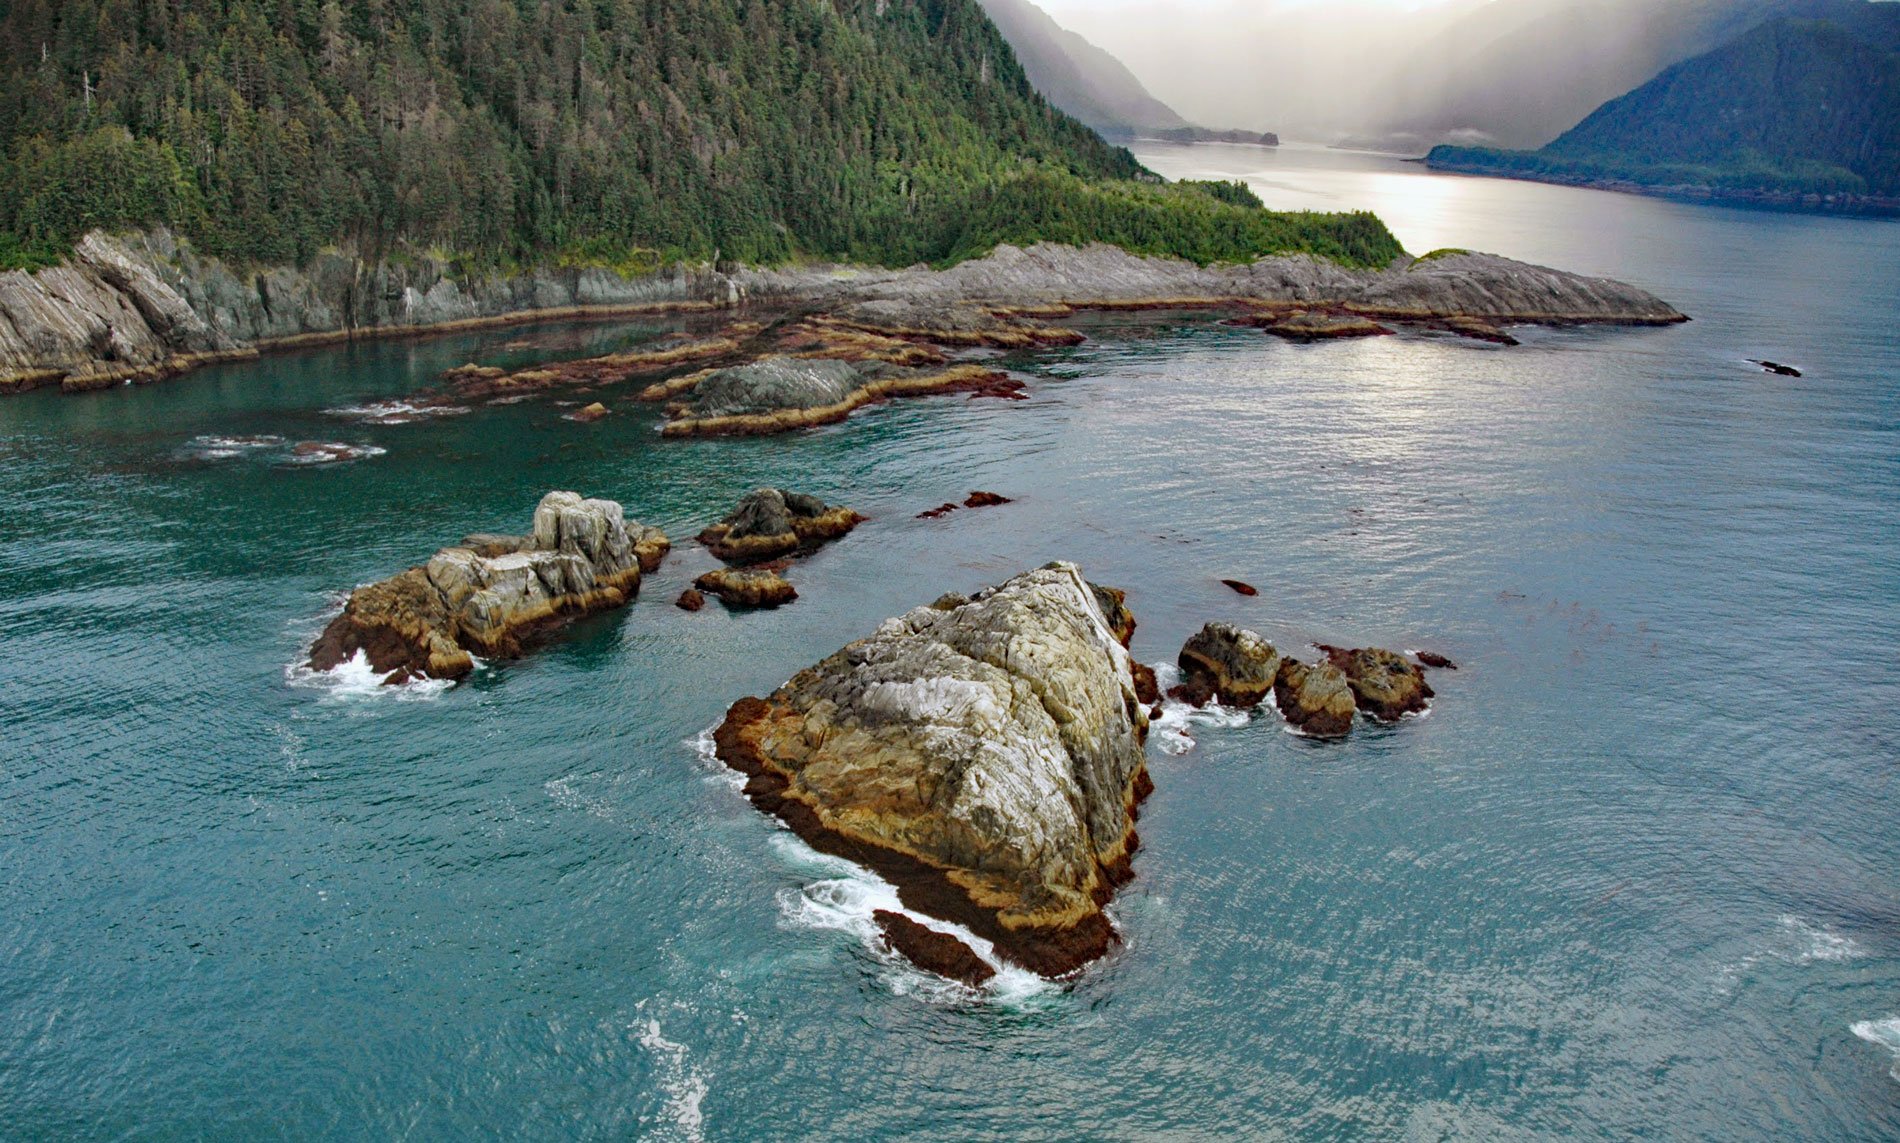
Torch Bay is about 3 miles (4.8 km) long, located on the outer coast of Glacier Bay National Park and Preserve about 7 miles (11.3 km) north of Cape Spencer, 52 miles (84 km) northwest of Hoonah and 41 miles (66 km) west-southwest of Gustavus, Alaska. The bay was named by the U.S. Coast and Geodetic Survey in 1926. Torch Bay was the site of a field camp established by the University of Washington in the 1970s to study the effects of sea otter reintroduction.
The early Russian colonization of Alaska was largely a result of the sea otter fur industry. An estimated 300,000 sea otters populated the West Coast of North America when Captain James Cook explored the area in 1778, but with as many as 18,000 pelts being collected yearly by Russian trading ships, the sea otters were quickly depleted. Alaska was sold to the United States in 1867, and in 1911 the sea otter population was estimated at less than 2,000. The Alaska Department of Fish and Game reintroduced 412 sea otters from Amchitka Island, where the Atomic Energy Commission was conducting underground nuclear weapons testing, and from Prince William Sound to 6 sites in Southeast Alaska between 1965 and 1969.
The studies in Torch Bay showed that where otters were reintroduced, there were extensive kelp beds and diverse ecosystems, but where otters weren’t found, sea urchins thrived but many other species did not. Sea urchins are a preferred food of sea otters so the effect of sea otter predation on urchins was profound. In areas with sea otters there were fewer urchins but more kelp beds, more fish, and more seabirds and eagles. These results led to a better understanding of keystone species and helped shape a new ecosystem conservation paradigm. Read more here and here. Explore more of Torch Bay here:

