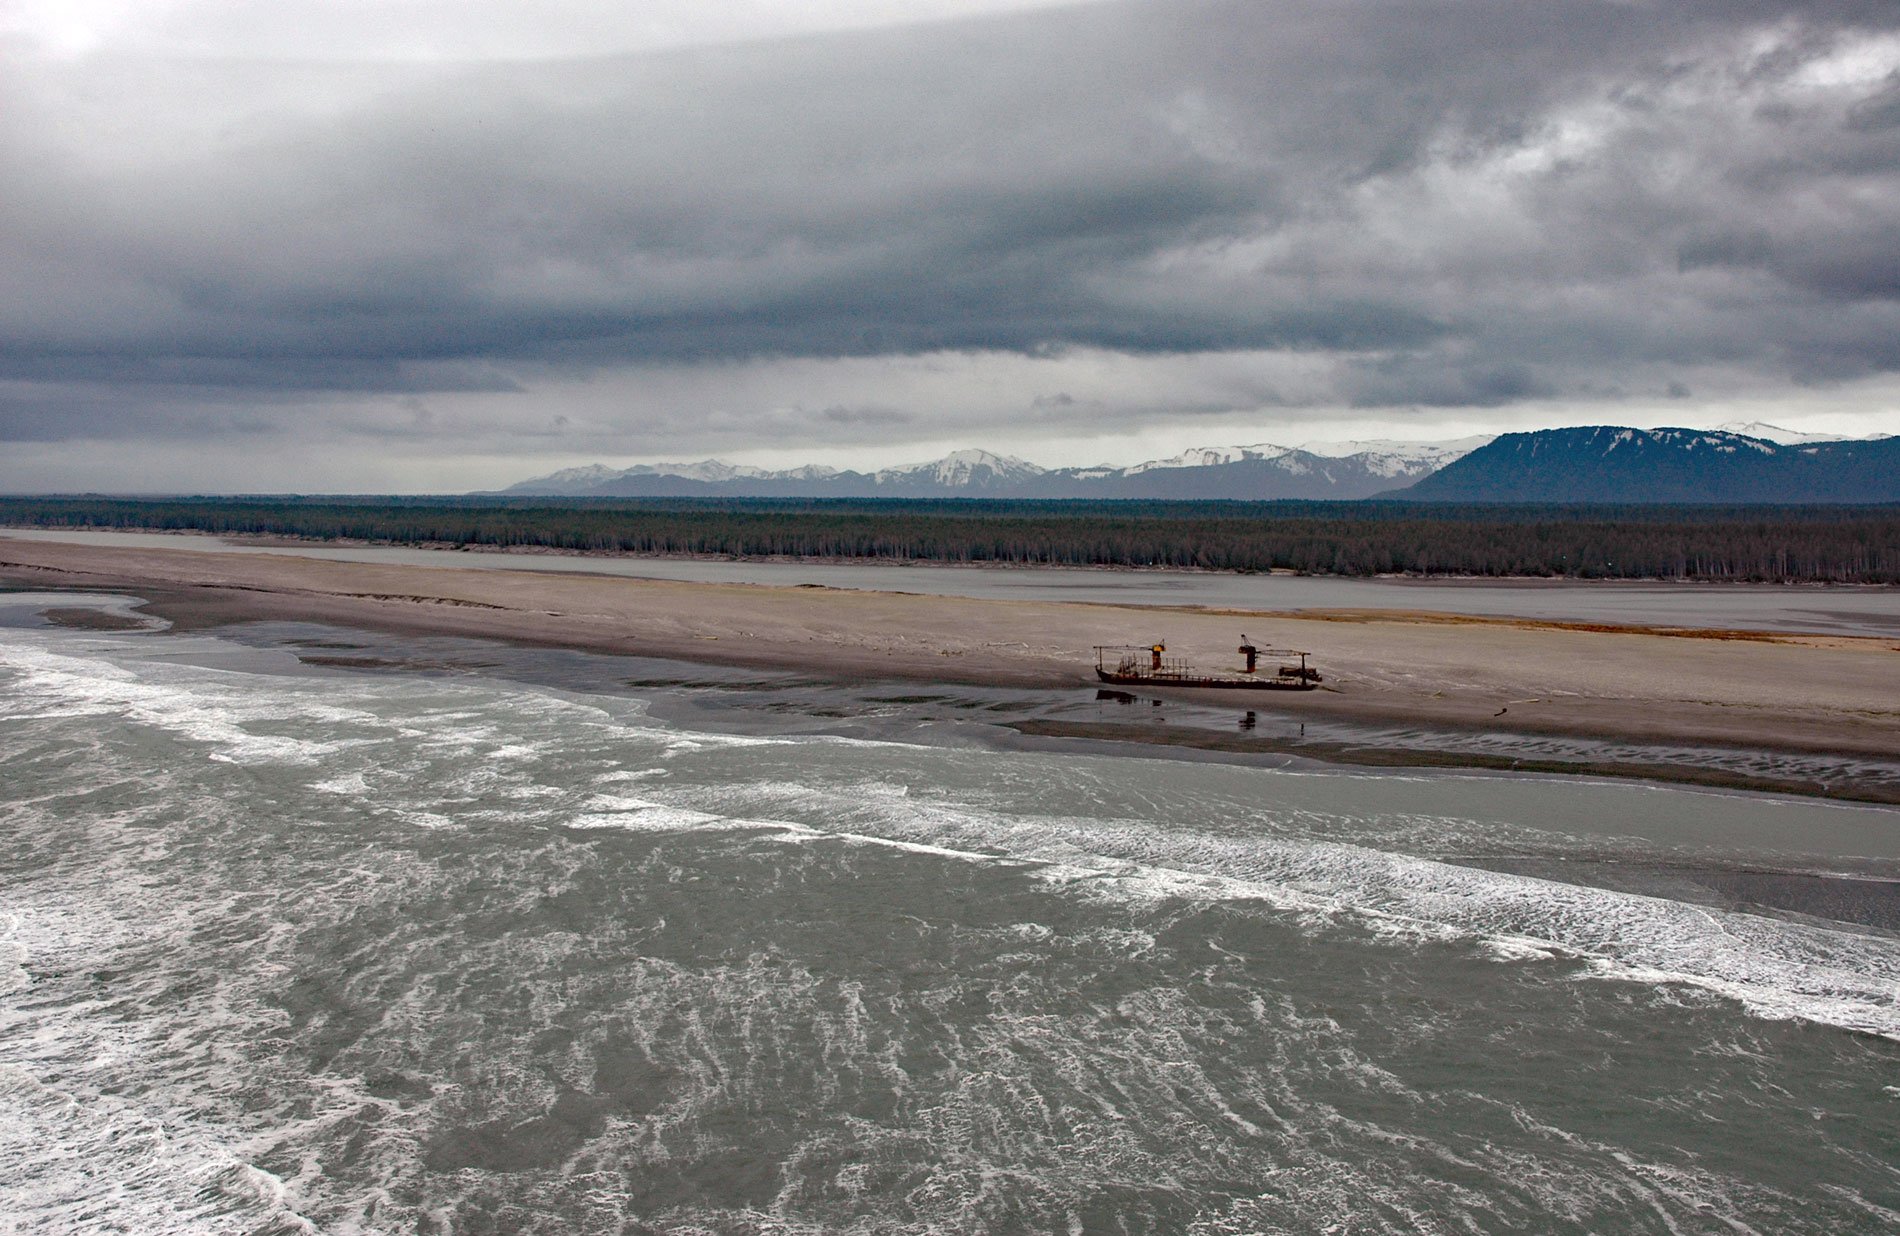
Kaliakh River starts in Hanna Lake and flows generally south through the Malaspina Coastal Plain for 24 miles (39 km) to the Gulf of Alaska, about 13 miles (21 km) northwest of Cape Yakataga and 106 miles (171 km) southeast of Cordova, Alaska. This may be the same stream labeled “small river” in Captain George Vancouver‘s atlas of 1798. The Tlingit name was first published in 1849 by Captain Mikhail Tebenkov, of the Imperial Russian Navy. The 1869 Coast Pilot spelled it “Kaliekh”.
The wreckage of a log barge lies partially buried by the Kaliakh River sand spit. Log barges were used to transport cut logs from coastal forests surrounding the Gulf of Alaska to regional sawmills such as the one in Jakolof Bay near Homer. Before the advent of log barges, log rafts were used to transport whole logs across the exposed waters of British Columbia and Alaska. Conventional boom rafts were used on protected waters, but these could not withstand the larger swells and rougher weather conditions of the open ocean. Davis rafts that consisted of log mats 130 feet (40 m) long woven together with steel cables were used instead. But the loss of logs during storms was significant, and many Gulf of Alaska beaches are still strewn with thousands of cut logs that escaped from these rafts.
Log barges were first used in the 1920s to transport logs more securely along the coast. The earliest barges were old ships’ hulls converted for the purpose. Self-dumping barges were introduced in 1954, and by the 1960s cranes had been added for self-loading. See a log barge in action here. But even with this technology, tow cables can still break and barges are occasionally lost at sea to eventually strand onshore or break apart. Read more here and here. Explore more of the Kaliakh River here:

