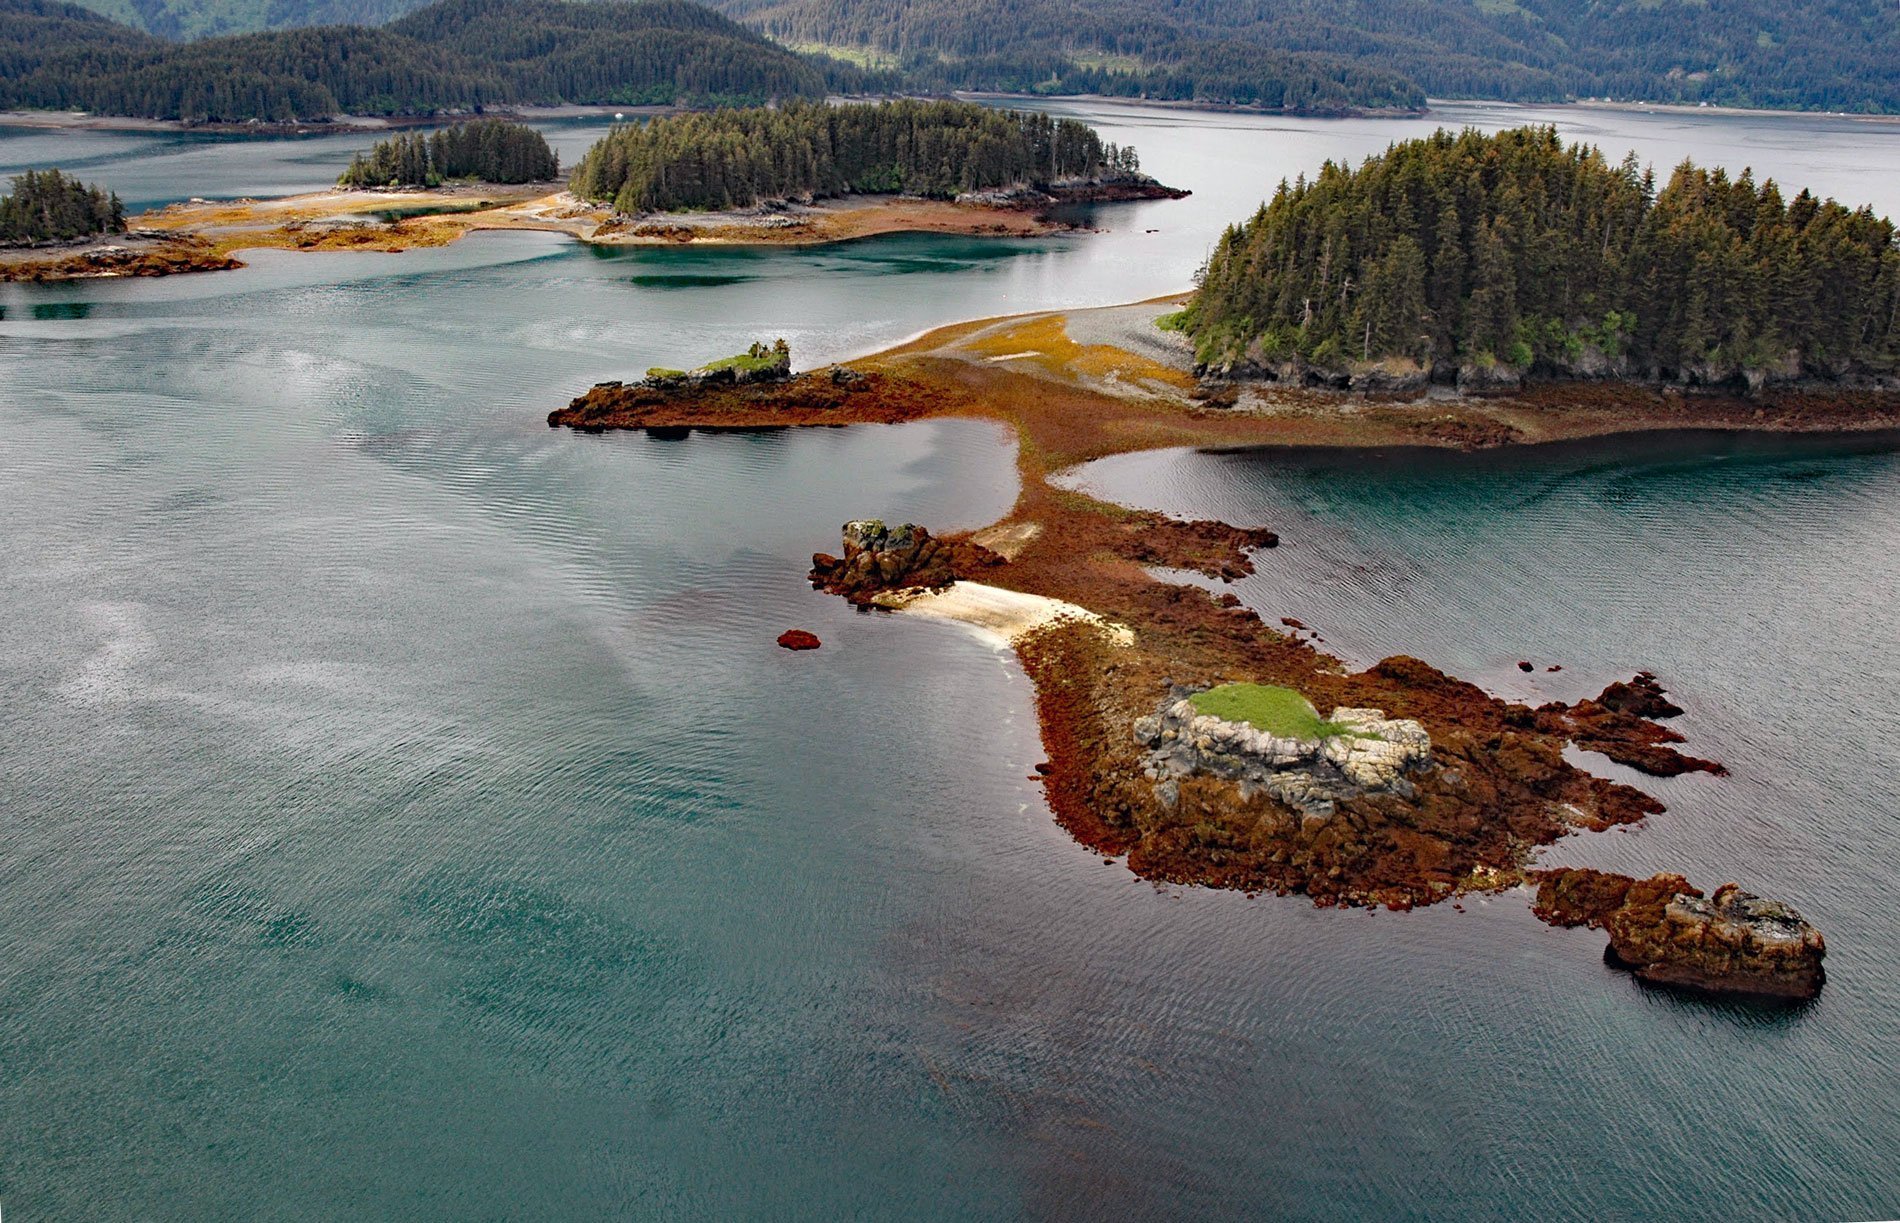
The Herring Islands are located at the entrance to Tutka Bay, on the southern shore of Kachemak Bay, 11 miles (18 km) south of Homer and 8 miles (13 km) northeast of Seldovia, Alaska. The islands were named by William Healey Dall of the U.S. Coast and Geodetic Survey in 1880.
Alaska’s commercial herring industry began in 1878 when early European settlers caught and preserved herring with salt in wooden barrels, as they had done with herring in the North Sea. Salted and pickled herring production for food peaked after World War I. In the 1920s, an abundant herring fishery in Cook Inlet and Kachemak Bay attracted fleets from the Pacific Northwest and California. Two herring salteries were built in Seldovia and several surplussed sailing ships from World War I were converted to floating salteries. Herring became increasingly valued for oil and reduction plants sprang up along the Gulf of Alaska near locations where concentrations of herring could be found. The herring were mostly processed to extract oil and the remains were ground up for fishmeal or discarded overboard. In Kachemak Bay, the rotting fish killed the shallow water seagrass utilized by spawning herring. Loss of spawning habitat and overfishing caused the herring fishery to decline and by the 1930s it was closed.
Seagrass or eelgrass is a key substrate used by Pacific herring for spawning in the nearshore habitats of the Pacific Northwest. Eelgrass grows on muddy and sandy bottoms in the shallow subtidal, usually submerged or partially floating, and acts as a protective nursery ground for fish and shellfish. Eelgrass beds grow rapidly in the spring and summer, then decay in the fall and winter. Dead eelgrass blades often wash up on the beach where their decay adds important nutrients to the coastal ecosystem. Herring are dependent on eelgrass for spawning. They lay eggs on eelgrass leaves and the juvenile fish are protected from predators within the eelgrass beds. Read more here and here. Explore more of Herring Islands here:

