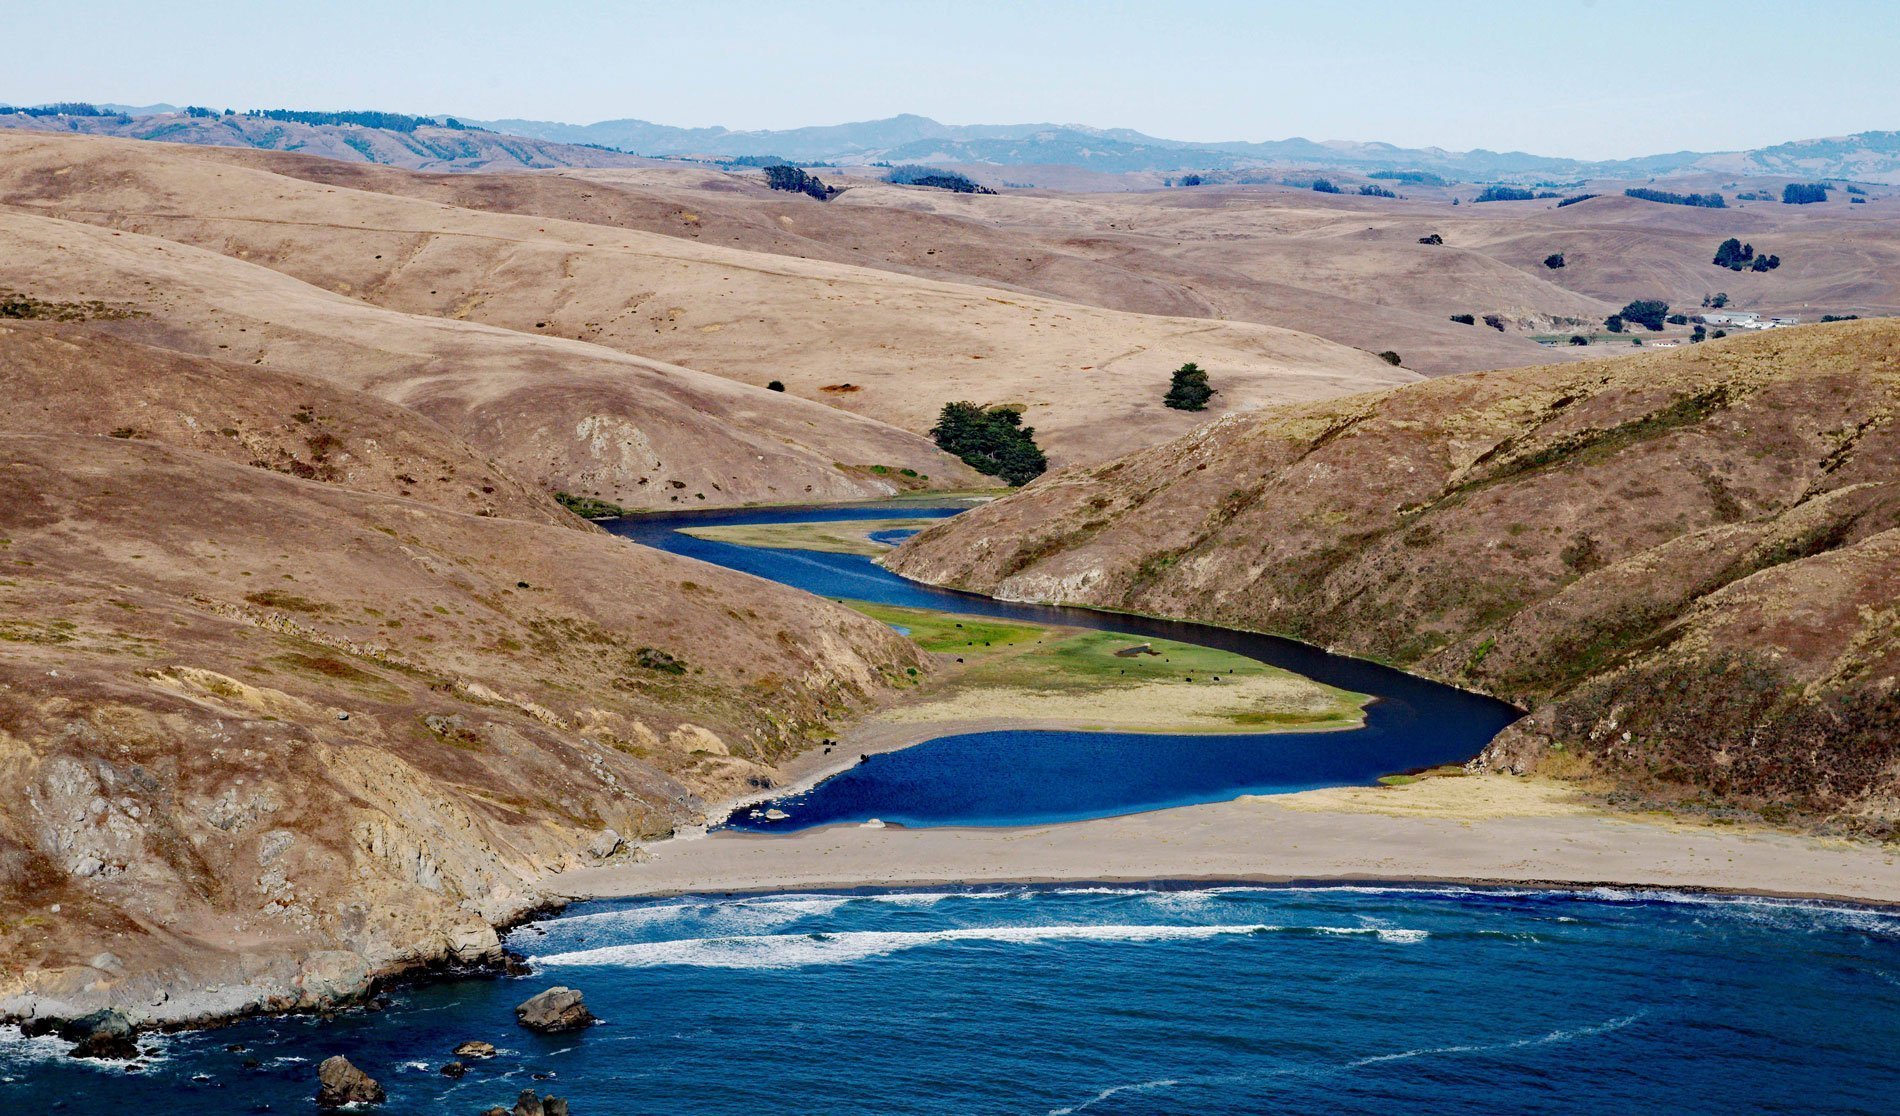
Estero de San Antonio is a small coastal lagoon formed by a sand bar that dams Stemple Creek, a stream that starts in the hills of Marin and Sonoma Counties and flows generally west to Bodega Bay near the mouth of Tomales Bay, 5.75 miles (9 km) southeast of the community of Bodega Bay and 1.5 mi (2.4 km) northwest of Dillon Beach, California. In some years, the seasonal sand bar at the mouth of Stemple Creek completely restricts tidal exchange, resulting in periods of hypersalinity in the estuary. When the mouth is open, the tidal influence can range upstream for 4 miles (6.5 km).
Historically, the Coast Miwok inhabited the beaches along the river mouth. From the beginning of European settlement in 1865, the watershed had mixed farming with small livestock herds and large areas of land cultivated for barley, wheat, vegetables, and potatoes. Poultry and egg production was an important part of the local economy from the 1930s through World War II. In 1977, the California Department of Fish and Game identified the Estero de San Antonio as one of the most significant habitat areas in the state. The watershed is a mosaic of habitat types including densely wooded riparian ravines, salt grass flats, mudflats, eelgrass beds, small freshwater ponds, and coastal oak woodlands occur in the upper watershed. Today 90% of the watershed is used for livestock grazing, mostly beef and sheep ranches in the Marin County portion with a few dairies.
Estero de San Antonio State Marine Recreational Management Area is a protected area of 0.09 square miles (23 ha) that includes the waters below the mean high tide within the lagoon. The marine protected area prohibits taking any living marine resources and is part of the Greater Farallones National Marine Sanctuary. Access to the beach is by boat only since private property restricts access from land. Read more here and here. Explore more of Estero de San Antonio here:

