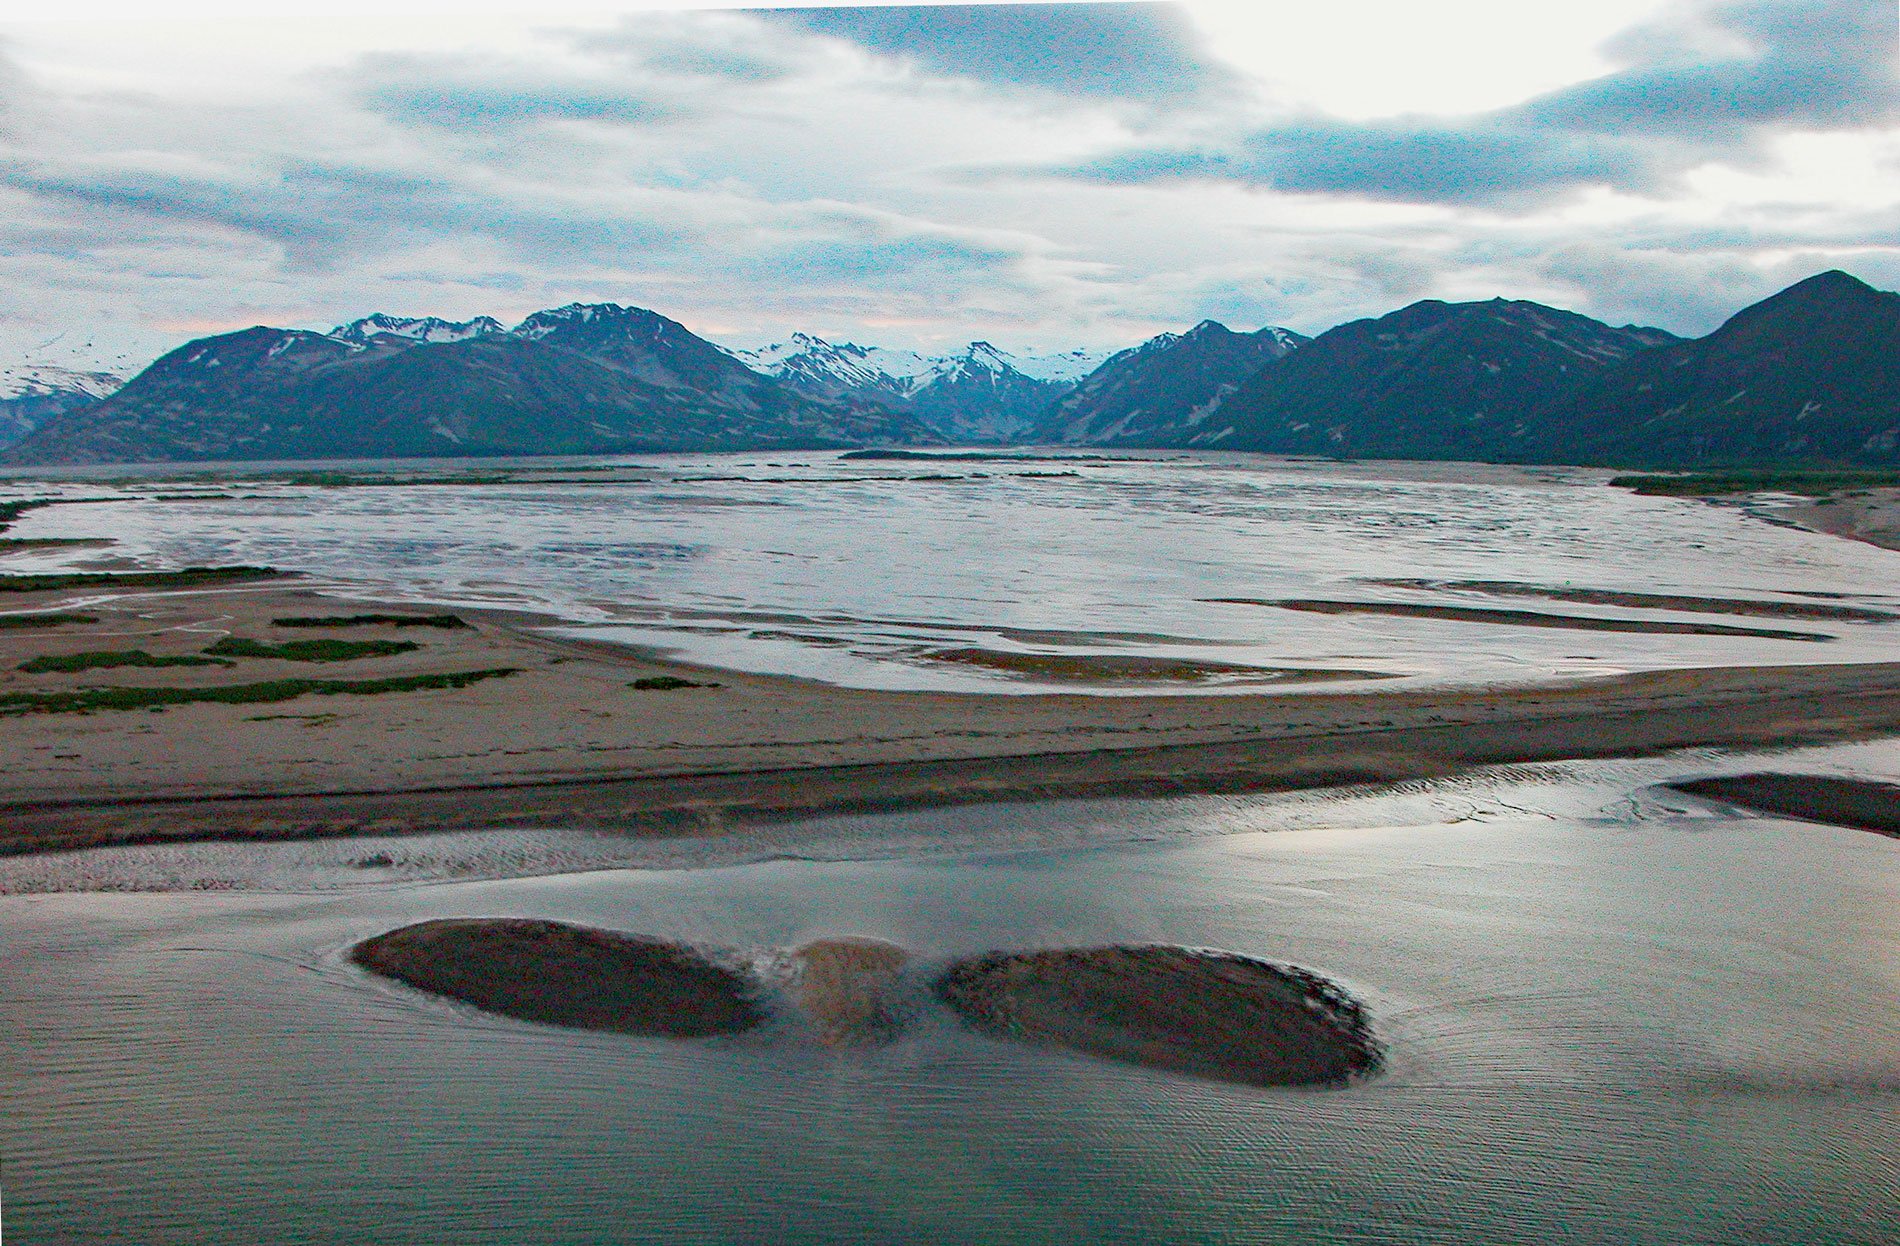
Katmai Bay is about 9 miles (14.5 km) across, located at the mouth of the Katmai River on the Shelikof Strait coast of the Alaska Peninsula, about 93 miles (150 km) west-northwest of Kodiak and 77 miles (124 km) southeast of King Salmon, Alaska. The native name was first reported in 1828 as “Katmaiskoi golfe” by Friedrich Benjamin Graf von Lütke, a German navigator, geographer, and Arctic explorer, in the service of the Imperial Russian Navy.
Mount Katmai is a large volcano on the Alaska Peninsula located within Katmai National Park and Preserve. Mount Katmai erupted on June 6, 1912, emitted ash and pyroclastic flows for over 60 hours, and formed a new volcano called Novarupta. Pyroclastic ash from the eruption flowed down the north side of Mount Katmai forming the Valley of Ten Thousand Smokes. The valley was named by botanist Robert F. Griggs who explored the area for the National Geographic Society in 1916. Ash also flowed down the Katmai River valley and into Katmai Bay on the south side of the mountain. The area surrounding Mount Katmai was originally designated a National Monument in 1918 to protect the Valley of Ten Thousand Smokes.
Three coastal villages at Katmai Bay, Kukak Bay, and Kaguyak Bay existed before the eruption. Katmai Bay village was the only location where European missionaries lived. During the eruption, ash fell 6 to 12 inches (15 to 30 cm) deep in Kodiak, and on the Alaskan mainland. Pumice can still be found on the beaches and floating in Katmai Bay. All three villages were permanently abandoned during or shortly before the eruption. Villagers from the Katmai coast moved south to start a new settlement at Perryville. Read more about Mount Katmai here and here. Explore more of Katmai Bay and the coast of Katmai National Park and Preserve here:

