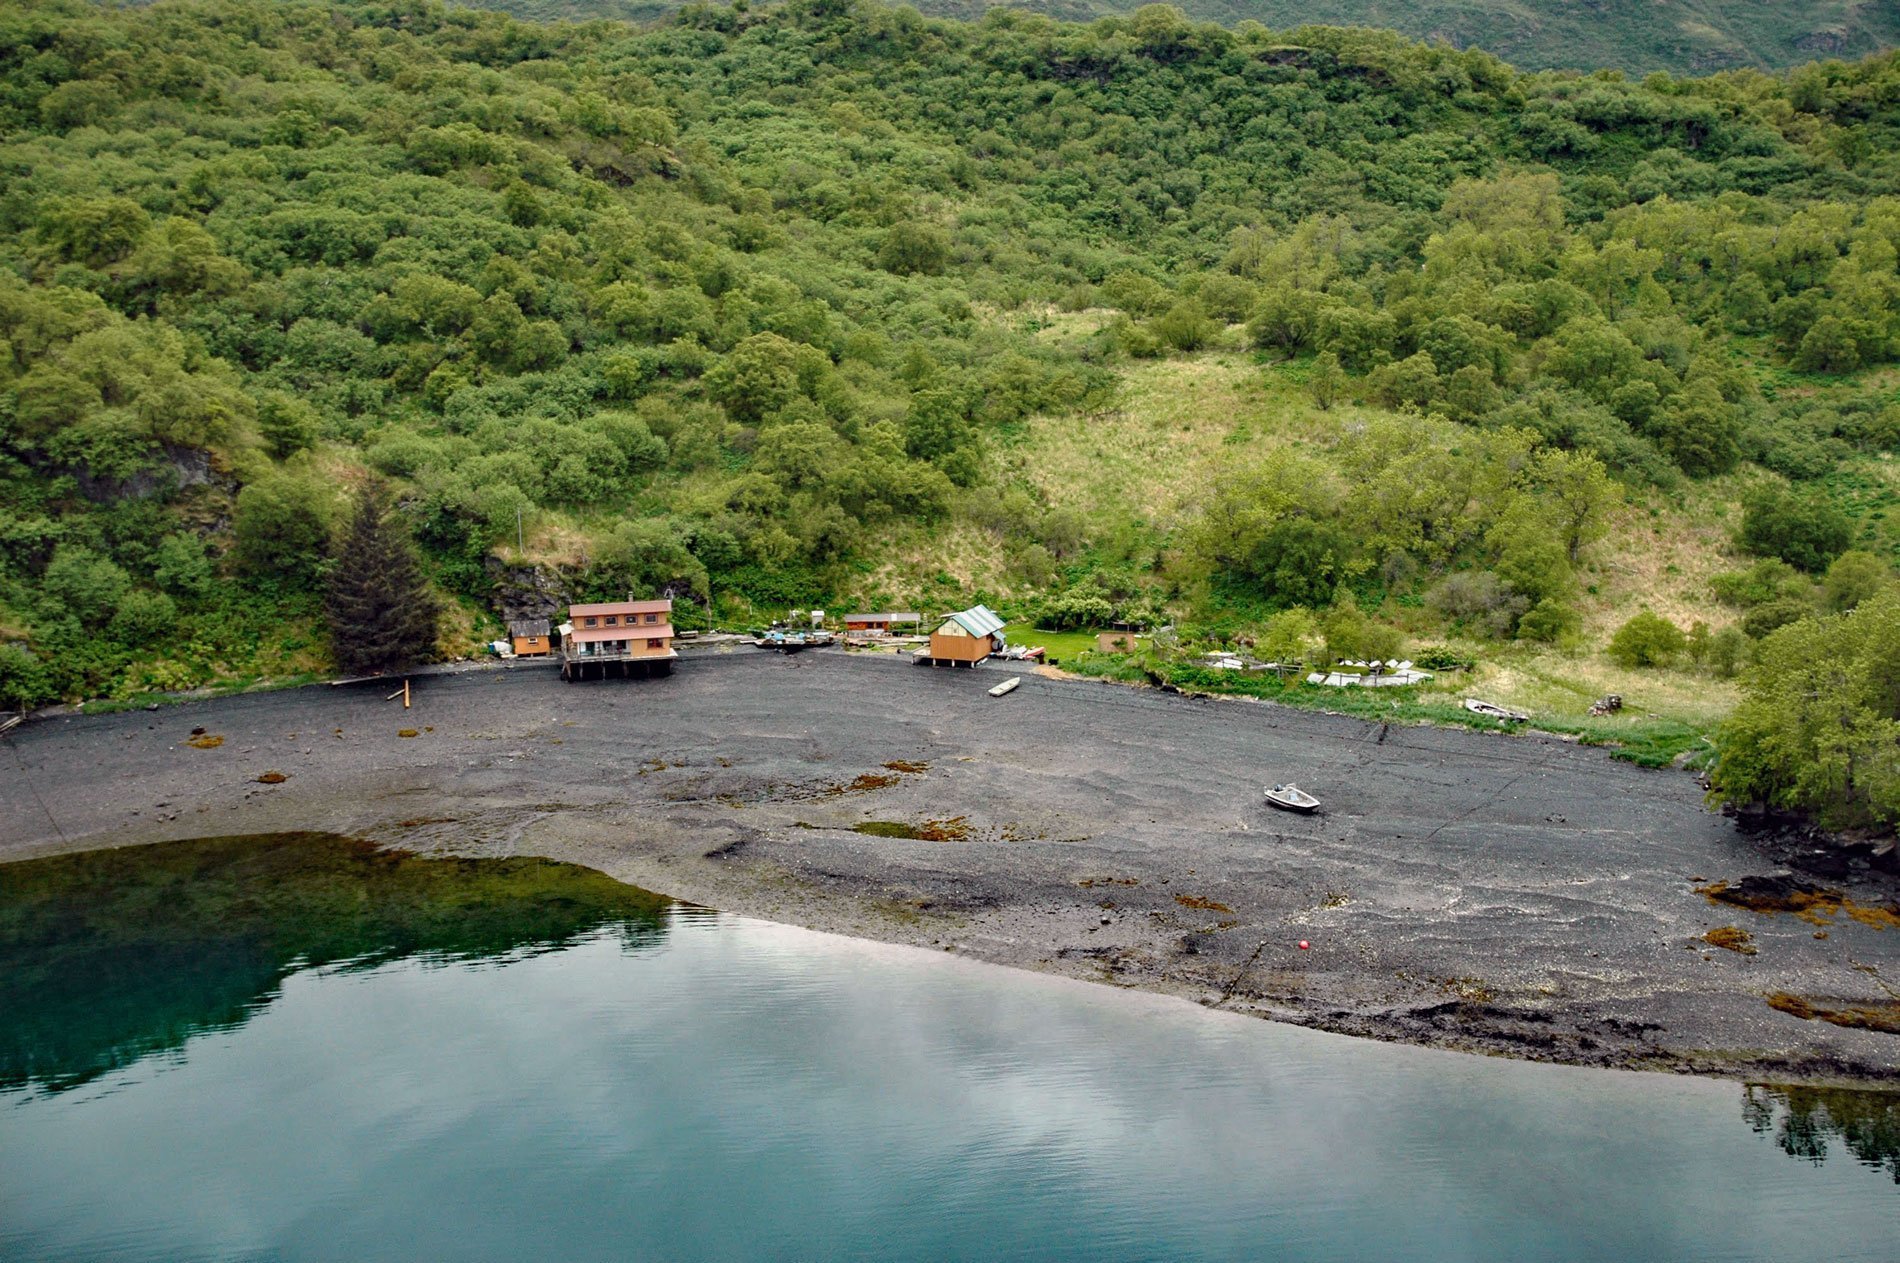
Mush Bay is the local name for a shallow embayment on the western shore of East Arm Uganik Bay, probably named after Mush Lake, on the west coast of Kodiak Island, 22 miles (35 km) northeast of Larsen Bay and 40 miles (65 km) west-southwest of Kodiak, Alaska. Mush Lake is 1.3 miles (2 km) long, located in the mountains between South and East Arms Uganik Bay. The name was first reported in 1954 by the U.S. Geological Survey. East Arm Uganik Bay extends southeast inland for 4 miles (6.5 km) from the west coast of Kodiak Island to the mouth of Uganik River. The descriptive name was given in 1897 by Lieutenant Commander J.F. Moser of the U.S. Navy on the U.S. Bureau of Fisheries steamer Albatross.
By the early 1920s, it had become increasingly clear that commercial interests had overfished and abused many of Alaska’s salmon fisheries. As a result, the U.S. Congress began to regulate the industry and in 1922 three fisheries reservations were established, one of which was the Southwestern Alaska Fisheries Reservation that included all of Bristol Bay, Cook Inlet, Kodiak, and the Alaska Peninsula. No new canneries were permitted and there would be no increase in the number of fish caught until better management legislation could be enacted. On Kodiak, a counting weir was constructed at Karluk and the Bureau of Fisheries would distribute 50 percent of the fish to the Larsen Bay and Uyak Bay canneries and the remaining 50 percent of the salmon would escape the fishery and continue to the spawning grounds.
In 1922, a small cannery at Mush Bay, operated by Fred A. Davidson and a partner named Hopp, was permitted to beach seine in Mush Bay and can 500 cases of sockeye salmon and salt another 200 barrels of Coho salmon. However, so few salmon were caught that only a couple hundred cases were hand packed and the operation went bankrupt. Read more here and here. Explore more of Mush Bay here:

