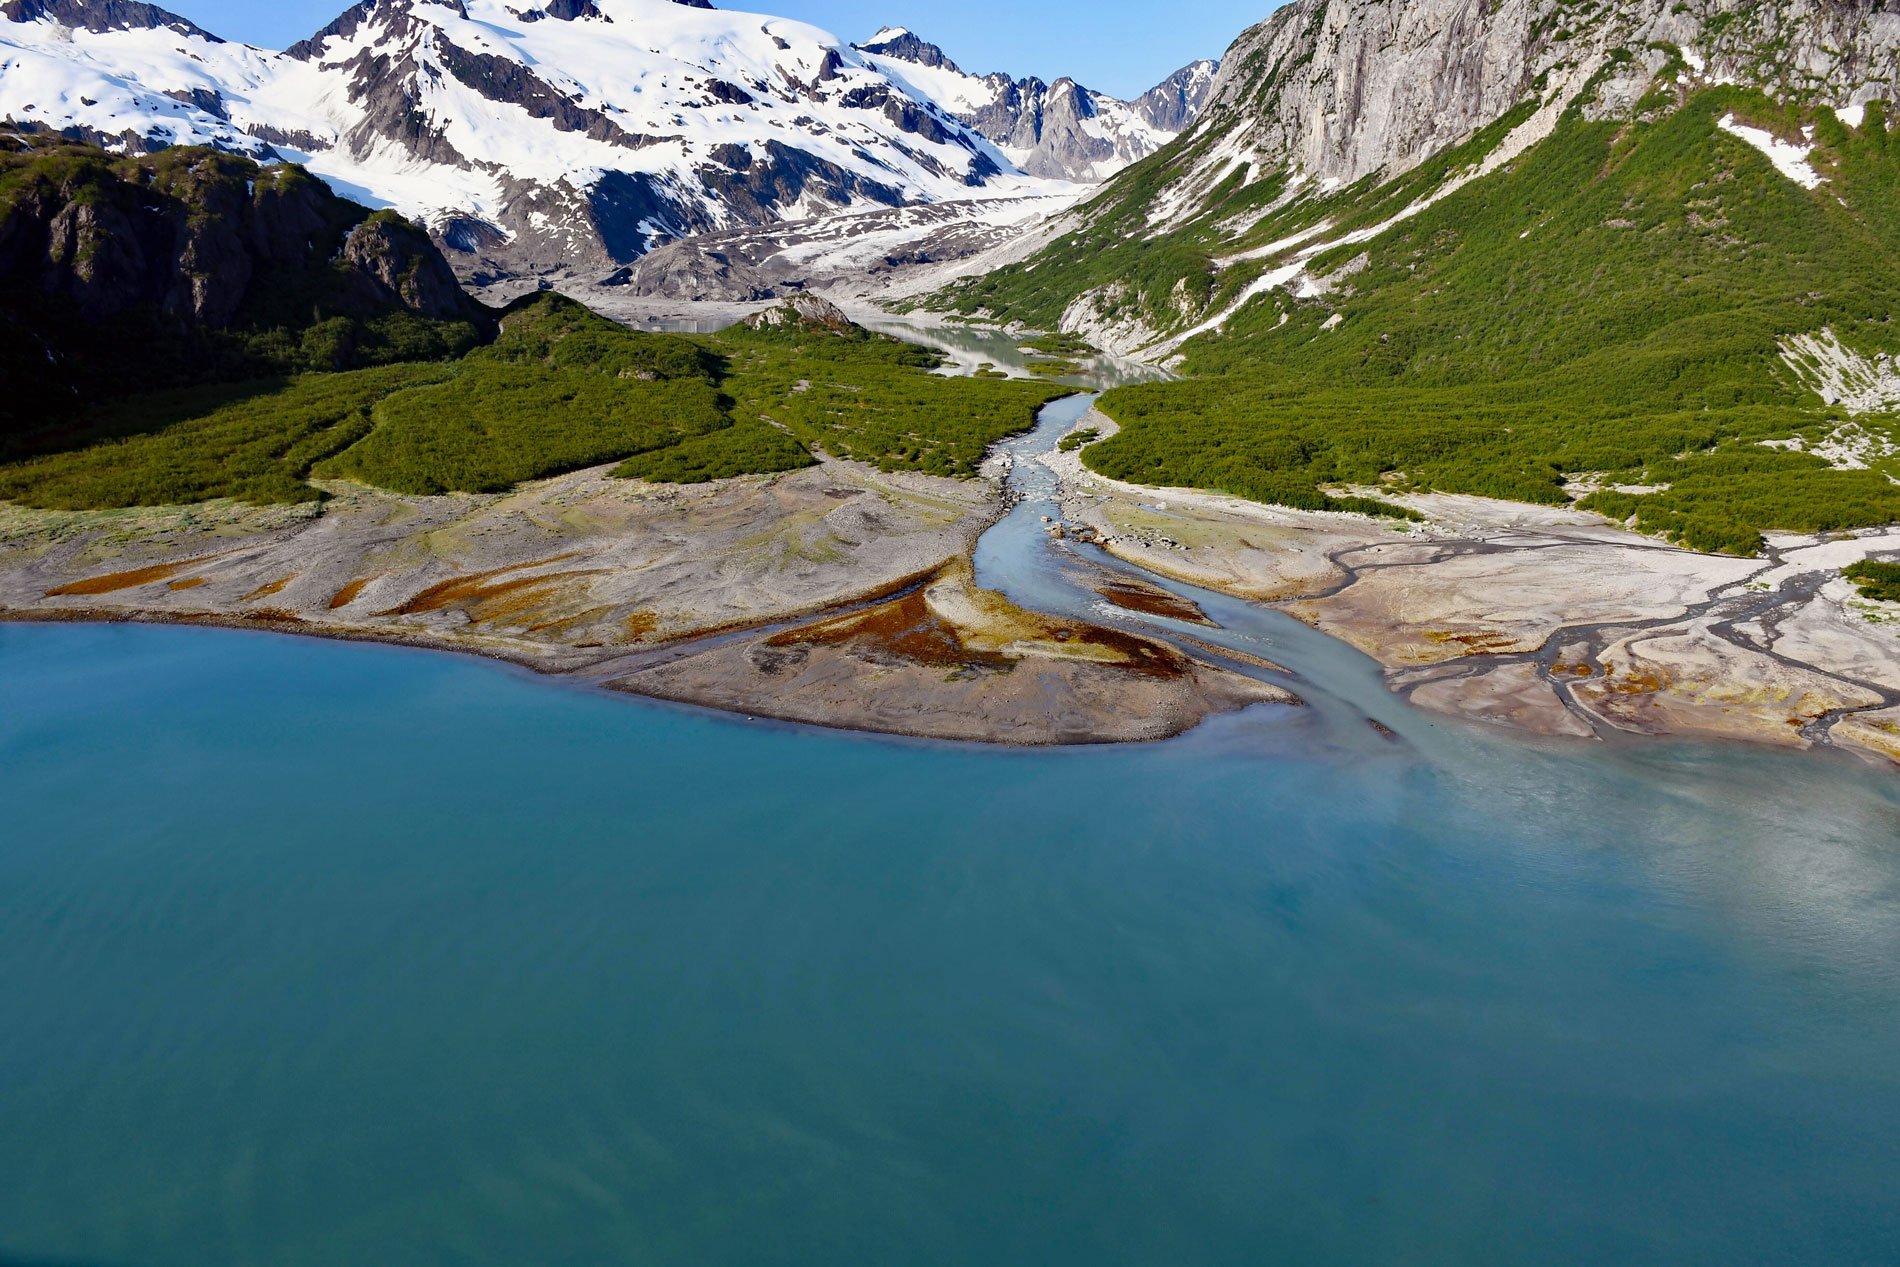
Southwestern Glacier is in Northwestern Fjord, a deep embayment in Kenai Fjords National Park and Preserve, about 50 miles (81 km) northeast of Homer and 33 miles (53 km) southwest of Seward, Alaska. Southwestern Glacier was once a tributary to Northwestern Glacier that filled the fjord in 1852 according to maps by Mikhail Dmitriyevich Tebenkov of the Imperial Russian Navy.
Northwestern Glacier starts in the Harding Icefield of the Kenai Mountains and flows south for about 4 miles (6.5 km) to its terminus at the head of Northwestern Fjord. The glacier was named in 1909 by Grant and Higgins of the U.S. Geological Survey for Northwestern University in Evanston, Illinois. At that time, Northwestern Glacier extended to the submerged terminal moraine now separating Harris Bay from Northwestern Fjord. By the 1950s, the terminus had retreated to the confluence with Southwestern Glacier. Today, the terminus of Northwestern Glacier is still in tidewater but has retreated 9.5 miles (15 km) from the 1909 position, and Southwestern Glacier has retreated about 0.7 miles (1.1 km) from tidewater.
Based on the most recent comprehensive survey in 2011, there were about 27,000 glaciers in Alaska including many active and former tidewater glaciers. However, the number of glaciers can be misleading and glaciologists are usually more interested in the total area covered by glaciers. The amount of land area occupied by glaciers in Alaska is trending downward. Glaciers in every mountain range and island group are experiencing significant retreat, thinning, and (or) stagnation, especially those at lower elevations. This process began in the middle of the 19th century and continues today. Read more here and here. Explore more of Southwestern Glacier here:

