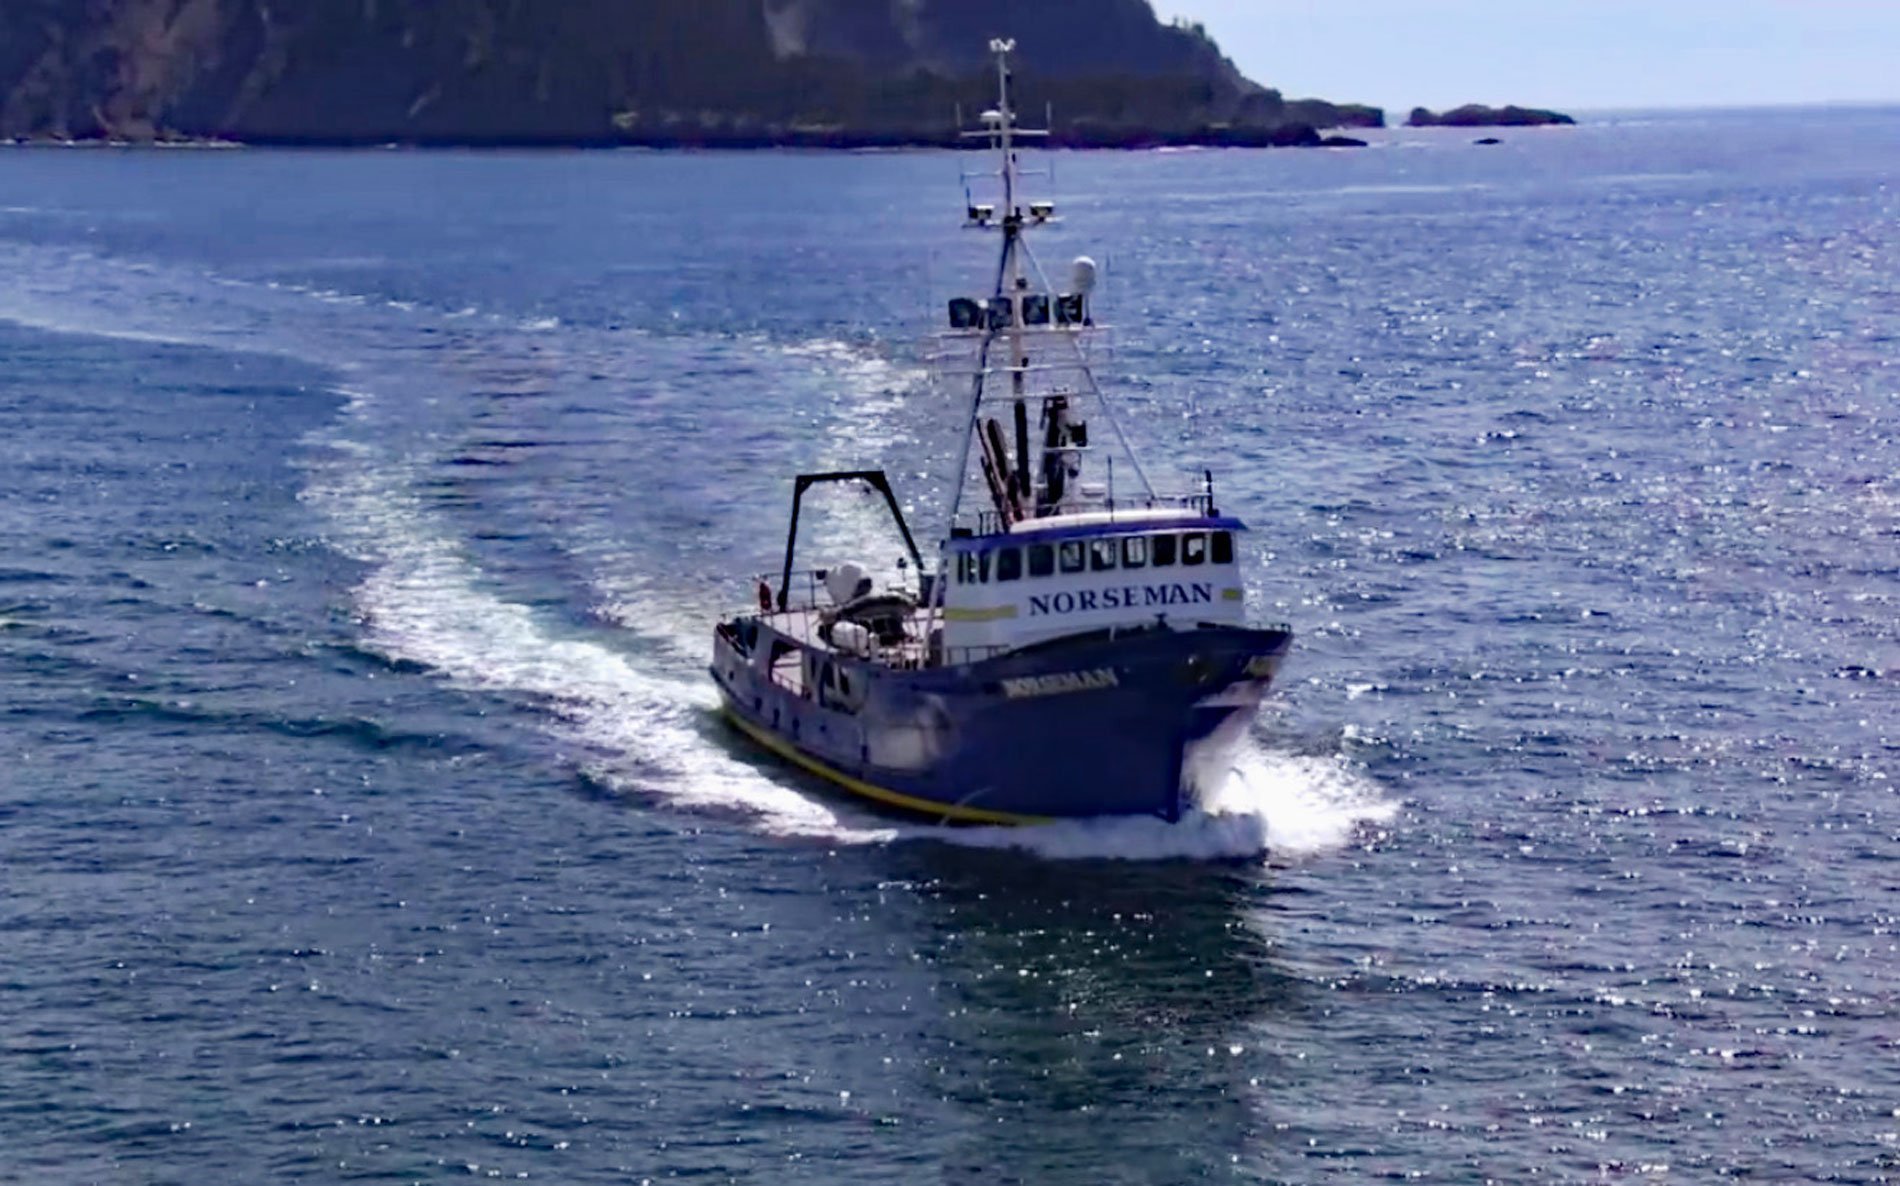
The fishing vessel Norseman sank in June 1978 in Princess Royal Channel, about 11 miles (18 km) southeast of Butedale and 115 miles (185 km) southeast of Prince Rupert, British Columbia. Norseman was built in 1973 as a crabber/tender and was in transit to the Bering Sea through the Inside Passage. The helmsman allegedly fell asleep and the big steel crabber ran into the rocky eastern shore of the fjord just north of Asher Point. The stunned crew managed to get ashore, and while they looked on, the Norseman quickly filled with water and slid stern first down the steep slope into deep water and disappeared.
Princess Royal Channel is located on the North Coast of British Columbia, separating Princess Royal Island from the mainland. The southern half of the channel is also called Graham Reach, and the northern half Fraser Reach. The southern half of the channel was first charted by Captain George Vancouver in 1793 with his ships Discovery and Chatham, which anchored about mid-way up the channel. James Johnstone, one of Vancouver’s lieutenants, charted its northern half the same summer.
Norseman came to rest perched precariously on a rocky pinnacle 400 feet (122 m) down the steep eastern slope of Graham Reach. Doug Anderson had earlier raised a vessel of 65 feet (19.8 m) from 195 feet (60 m) of water using railroad tank cars for buoyancy. With the profits from that salvage job, he purchased a used tugboat and set out to raise the Norseman. The job took five months, due mostly to bad weather and the remoteness of the site. After the vessel was brought to the surface, the salvage crew patched the hole in the bow and towed her to Seattle where she was sold for a hefty profit. The Norseman eventually returned to fishing and became well known as an Alaskan highliner. In 2005, she was converted into a charter research vessel and in 2019 was renamed Steadfast. Read more here and here. Explore more of Princess Royal Channel here:

