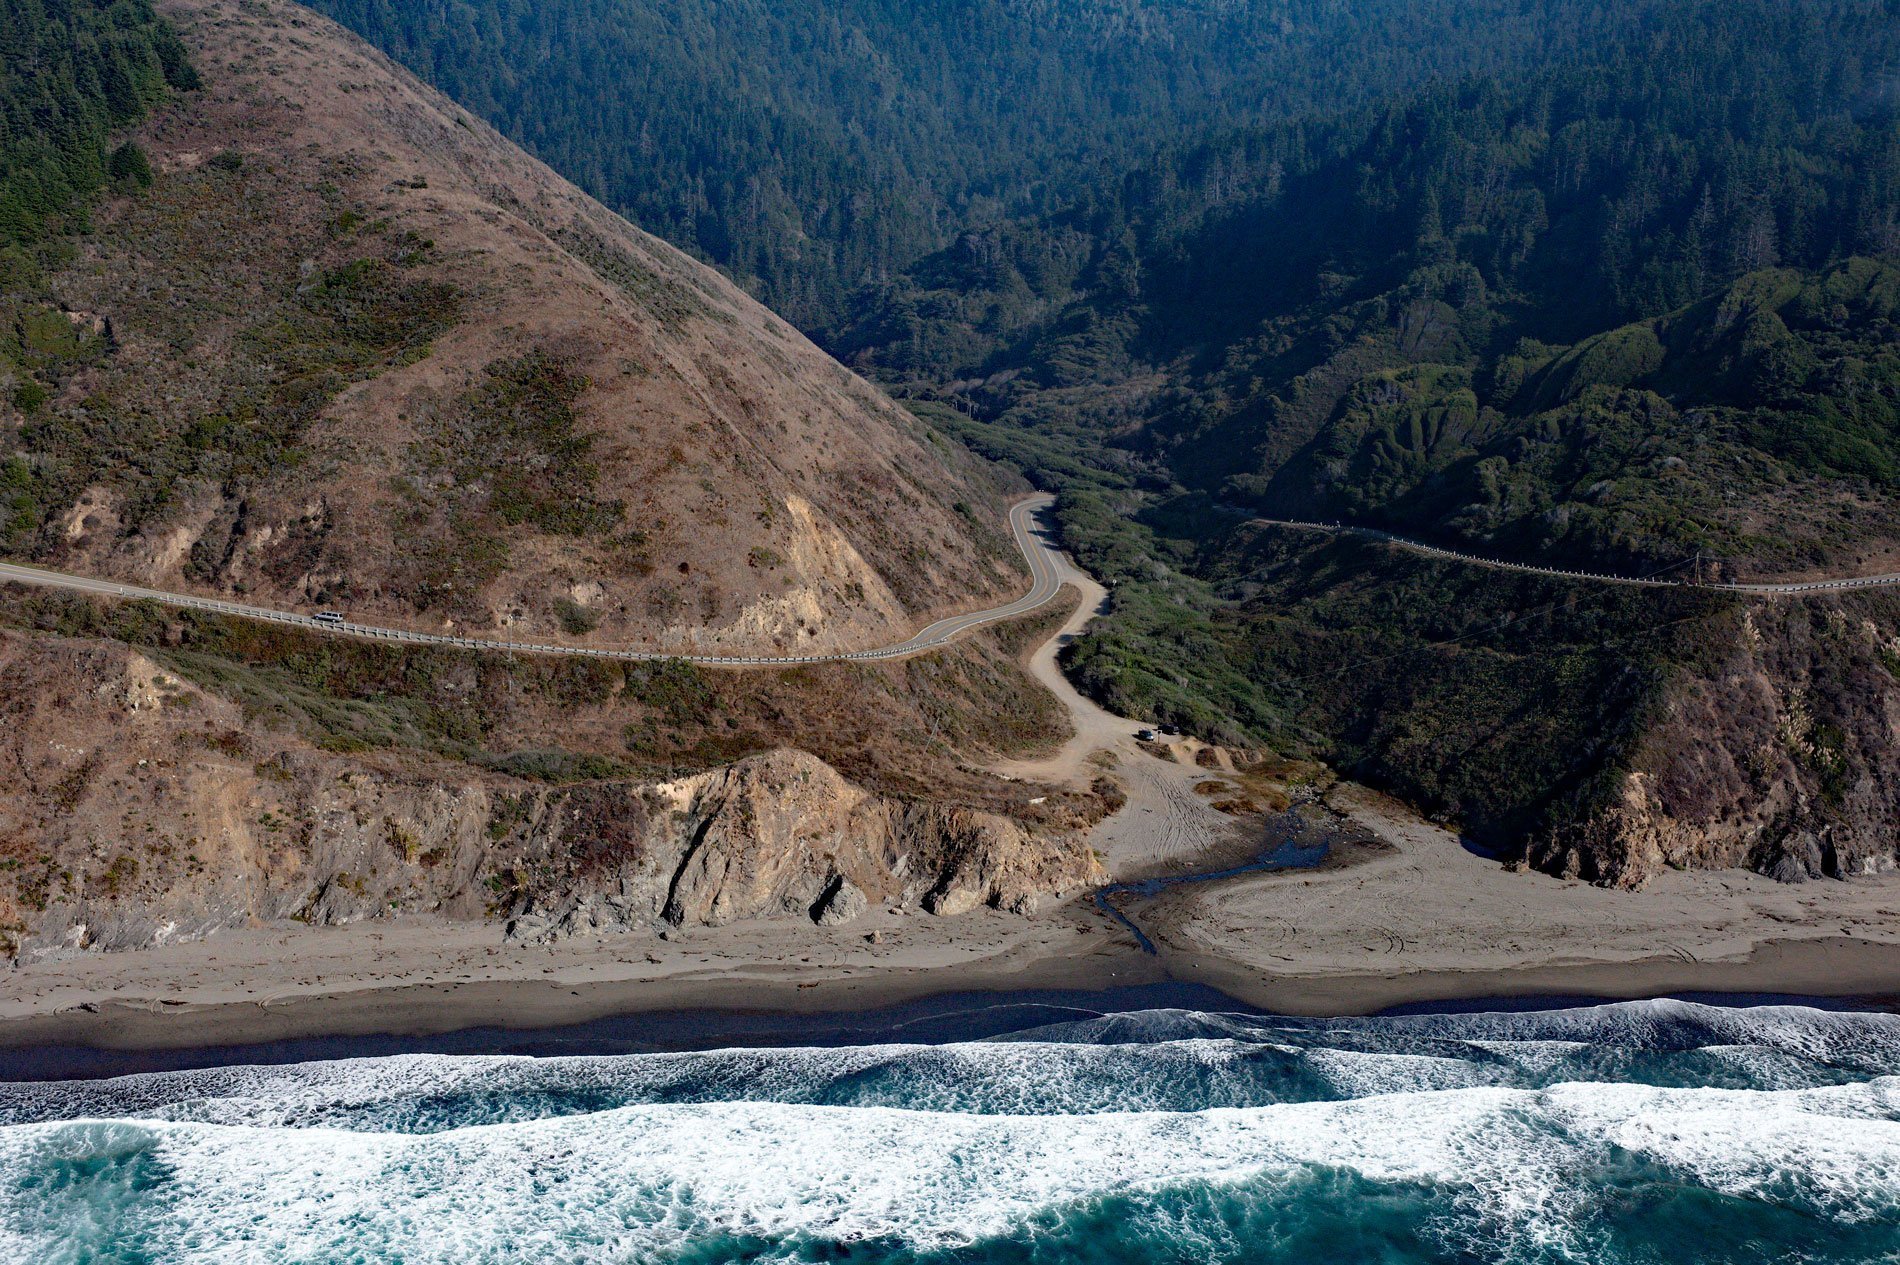
Chadbourne Gulch is a small stream that flows to the Pacific Ocean at Blues Beach between Bell Point to the north and Bruhel Point to the south, about 12 miles (19 km) north of Fort Bragg and 1.8 miles (2.9 km) south of Westport, California. The stream drains a watershed of approximately 1,730 acres (700 ha) with elevations reaching 560 feet (171 m) near the headwater divide. The watershed is dominated by mixed hardwood and conifer forests and is primarily privately owned and managed for timber production and recreation.
This area was historically inhabited by several groups of Northern Pomo, particularly the Mitom and Mato people. The Coast Yuki people also occupied the area north of Fort Bragg but were an entirely different language group from the Pomo. They were a small subgroup of a much larger population that claimed inland territory further north near present-day Ukiah. When lumber mills first began sprouting along the Mendocino coast in the 19th century, Native Americans were still a constant presence. Suppression of the Mitom and Mato people by Euro-American settlers occurred over an extended period of time. The Coast Yuki were eventually confined on a reservation called the Round Valley Rancheria.
The beach at the mouth of Chadbourne Gulch is known locally as Blues Beach and can be accessed by vehicles; however, the stream mouth and soft sand can be hazardous. There are rocks offshore on the north end of the beach including one with a large natural arch. Low summer stream flows typically cause the beach to build and block the stream outflow, and the creek flows across the middle portion of the beach during rainy periods. The stream includes anadromous fish habitats and the potential for coho salmon and steelhead trout enhancement. The principal watershed landowner is currently Georgia-Pacific, an independently operated pulp and paper company of Koch Industries, and one of the world’s largest manufacturers and distributors of paper products and building lumber. Read more here and here. Explore more of Chadbourne Gulch here:

