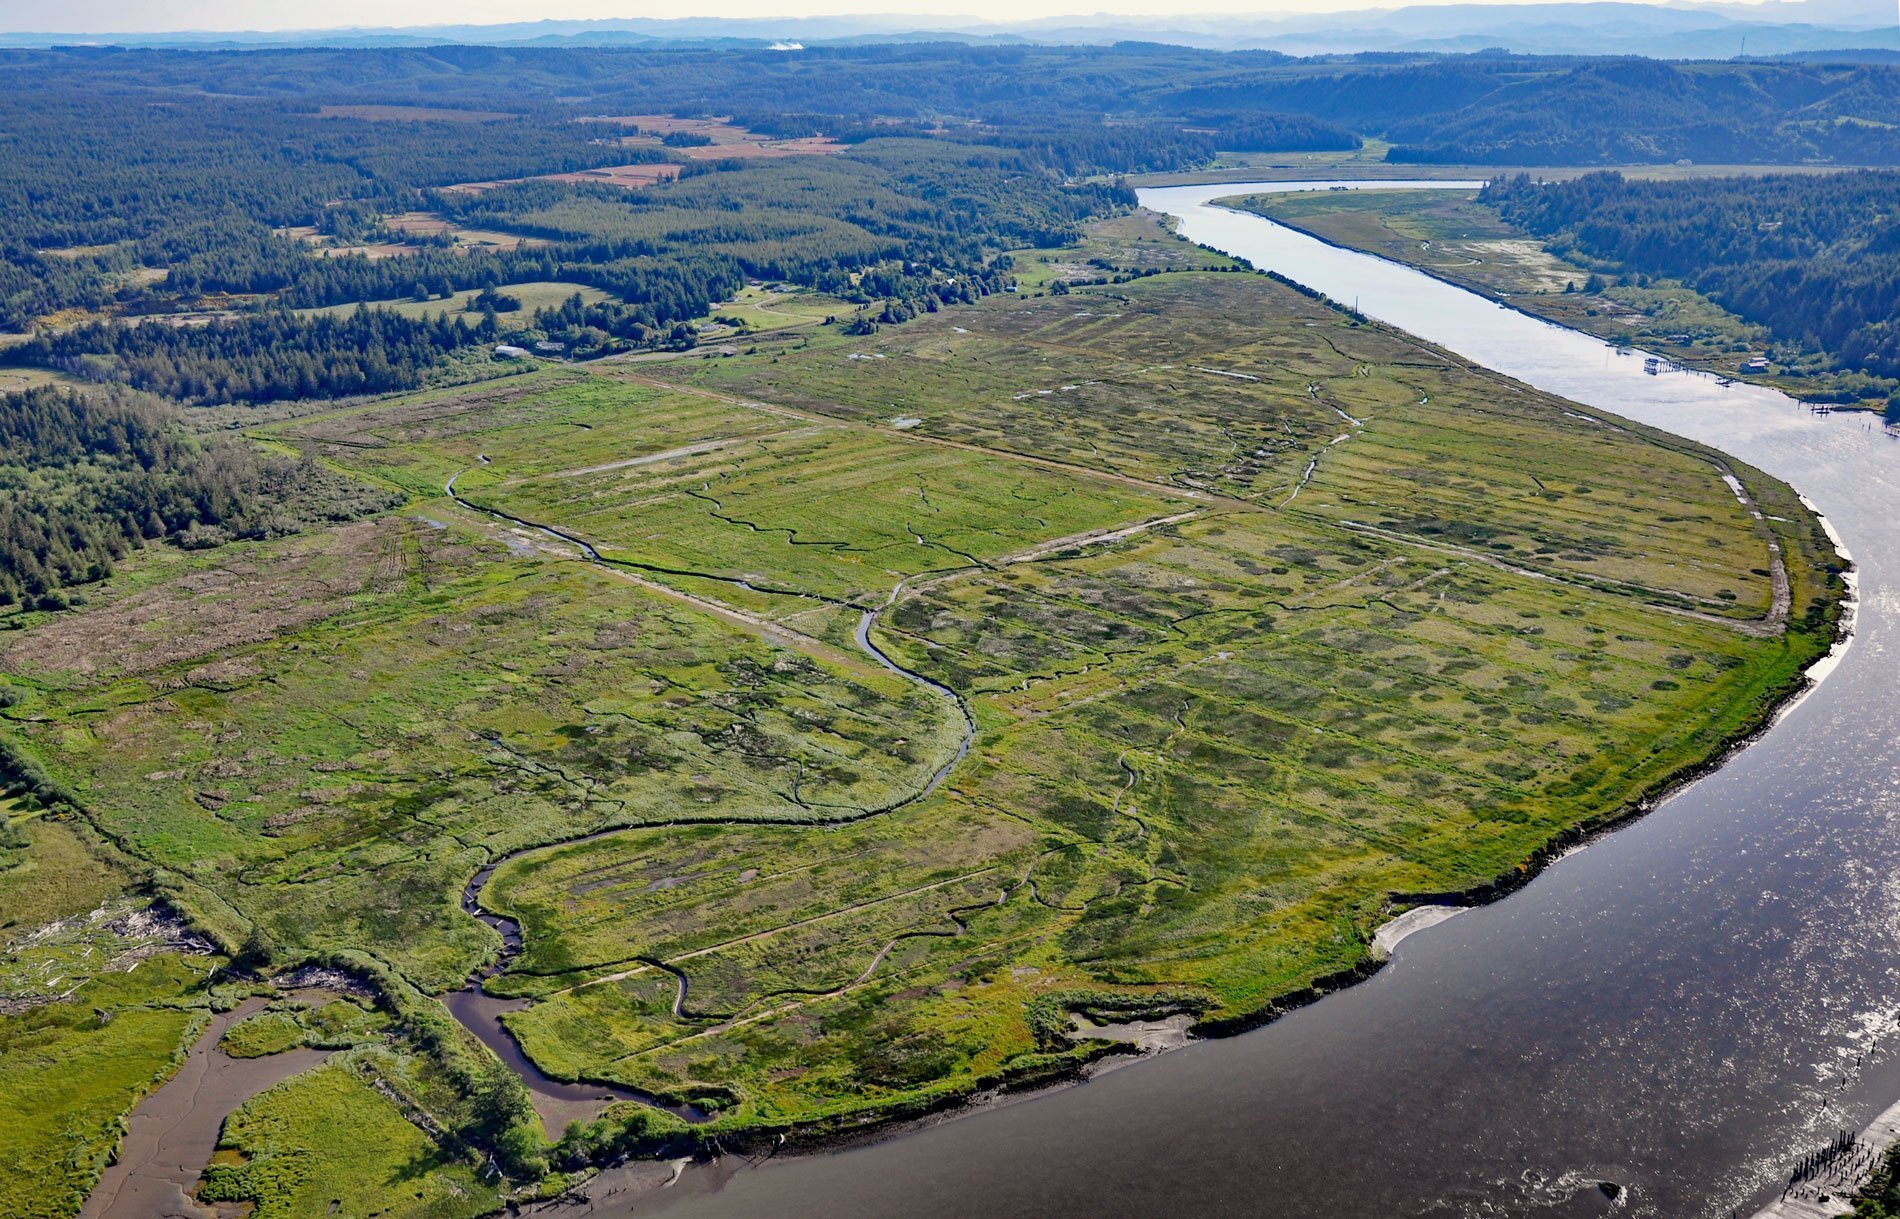
Coquille River drains a watershed of 37,760 acres (15,281 ha) in the Coast Range between the Coos River to the north and the Rogue River to the south, and enters the Pacific about 20 miles (32 km) north of Cape Blanco at Bandon, Oregon. The river is about 36 miles (58 km) long and is formed by the confluence of the North Fork, which is about 53 miles (85 km) long, and the South Fork, which is about 63 miles (101 km) long. The head of the tide is 41 miles (66 km) upriver from the mouth and the rise and fall of the tides cause salt intrusion that prevents common types of farming.
Tide gates and levees are used extensively in Washington, Oregon, and California to drain salt marshes along coastal estuaries for agricultural use or other developments. However, salt marshes serve a valuable role for juvenile fishes and as wildlife habitat, and restoration efforts are underway in coastal communities like Bandon to reclaim this valuable habitat. Along the Pacific Northwest coast, wild salmon populations continue to decline. Like many Pacific northwestern rivers, the Coquille has lost much of its estuarine habitat, for example, nearly 95 percent of prime salmon spawning and rearing waters are no longer available.
A unique partnership of federal, state, tribal, and local agencies, the agriculture industry, and the environmental community worked together on a mutually beneficial habitat restoration project supporting salmon recovery in the Coquille River Estuary. The project installed new tide gates and developed 8 miles (13 km) of tidal channels and 2.7 square miles (699 ha) of habitat for coho salmon allowing for seasonal use by agriculture in the summer, and fish and wildlife in the winter. Read more here and here. Explore more of the Coquille River Estuary here:

