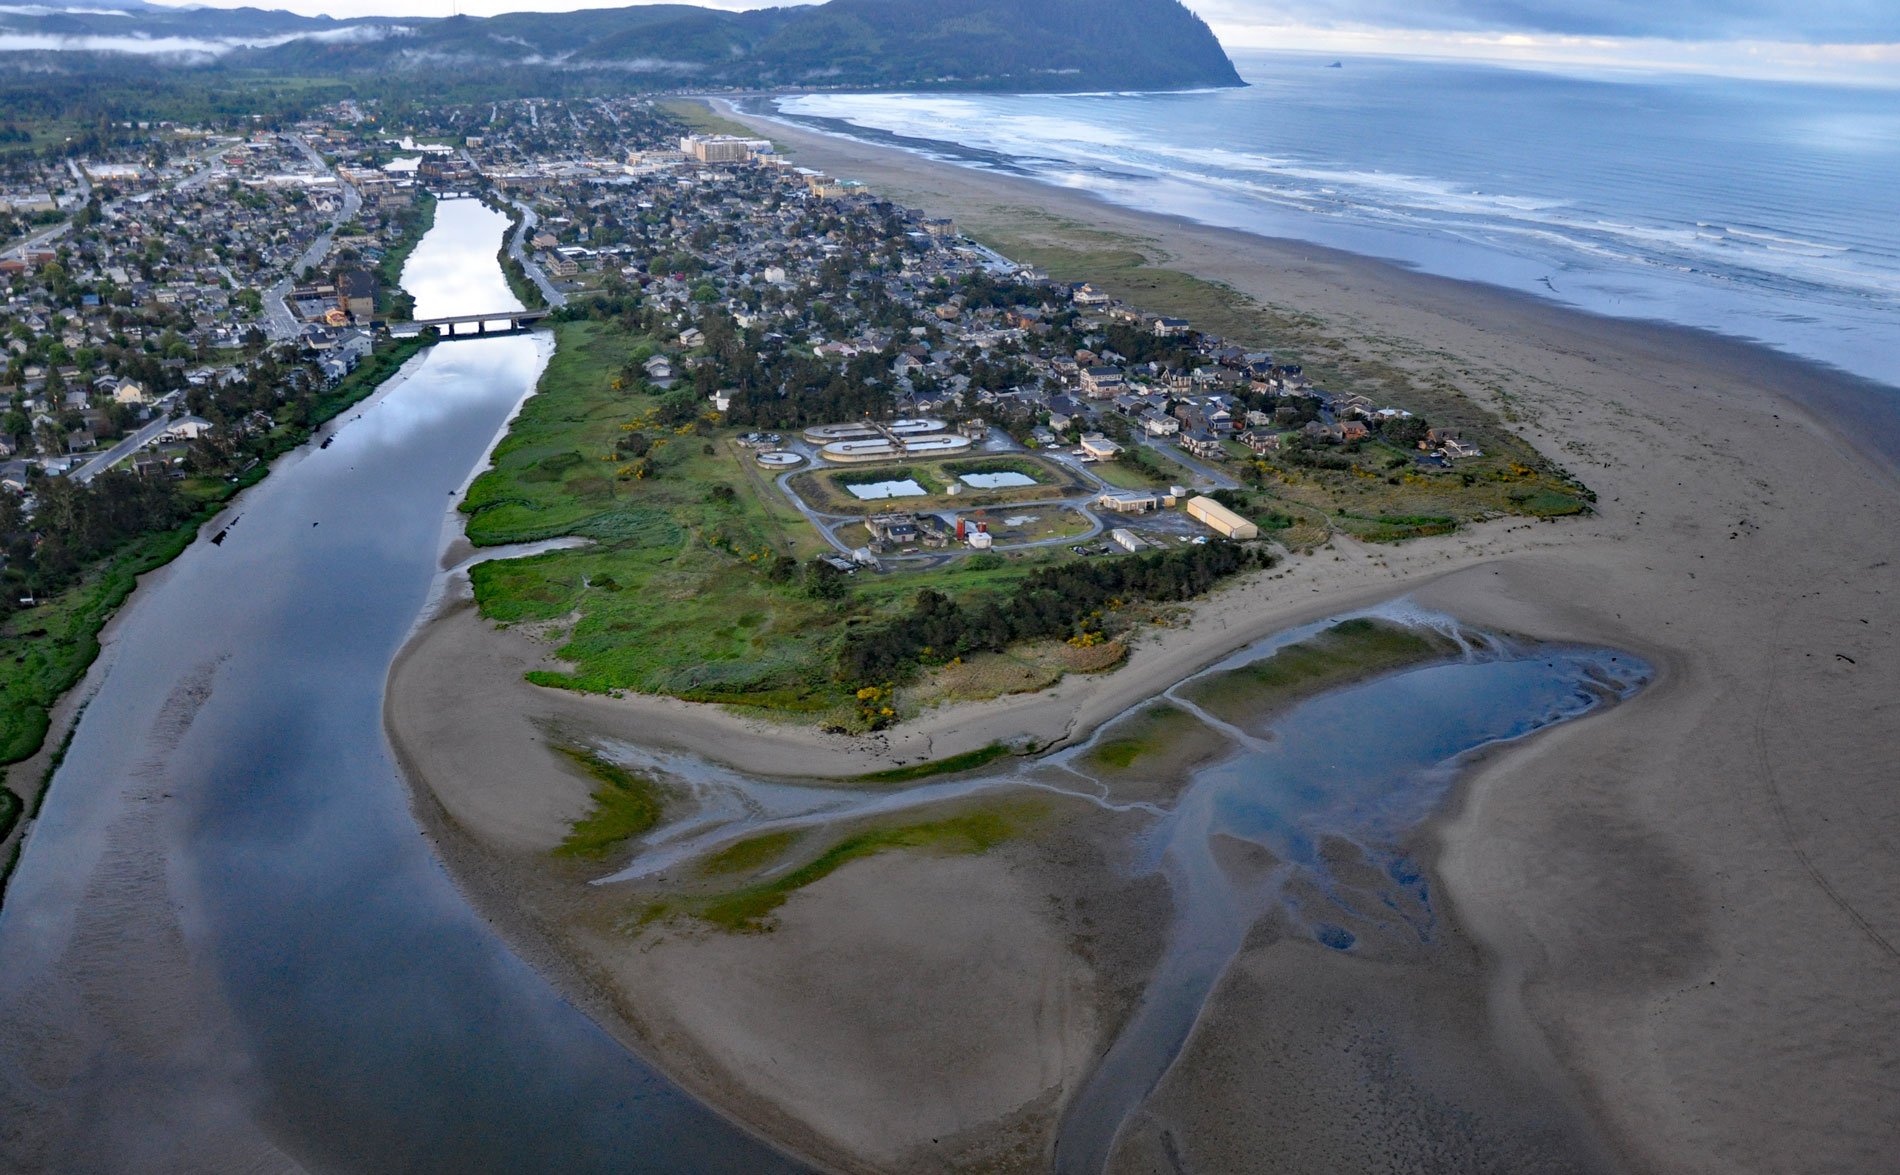
Necanicum River is approximately 21 miles (34 km) long draining a watershed of 84 square miles (21,756 ha), and forms the first estuary south of the Columbia River about 70 miles (113 km) northwest of Portland and 13 miles (21 km) southwest of Astoria at the coastal community of Seaside, Oregon. The river name is derived from Ne-hay-ne-hum, the name of a historical Native American village located here. In the mid-1800s, three tribes of Native Americans would gather in the Necanicum estuary each fall to fish for salmon.
About January 1, 1806, a group from the Lewis and Clark Corp of Discovery expedition built a salt-making cairn at the mouth of the river, and William Clark named it Clatsop River. The river was later known as Latty Creek, for William Latty, an early pioneer. The name for the community of Seaside is derived from Seaside House, a historical summer resort built in the 1870s by railroad magnate Ben Holladay. Seaside developed on both sides of the Necanicum River and is now a popular destination for visitors attracted to the wide sandy beaches.
The Necanicum River watershed is an important habitat for several anadromous fish including Chinook, coho, and chum salmon, steelhead, sea-run cutthroat trout, and Pacific lamprey. Coho salmon use the entire Necanicum River watershed but despite this extensive habitat, the population is now reduced to about 600 fish due mostly to habitat degradation from logging, mining, water withdrawals, livestock grazing, road construction, stream channelization, diking of wetlands, and urbanization. In 2006, the Thompson Creek-Stanley Marsh wetland restoration project of the North Coast Land Conservancy began opening ditches that border 80 acres (32 ha) of pasture so that it can be restored to a functioning tidal wetland. Read more here and here. Explore more of Necanicum River here:

