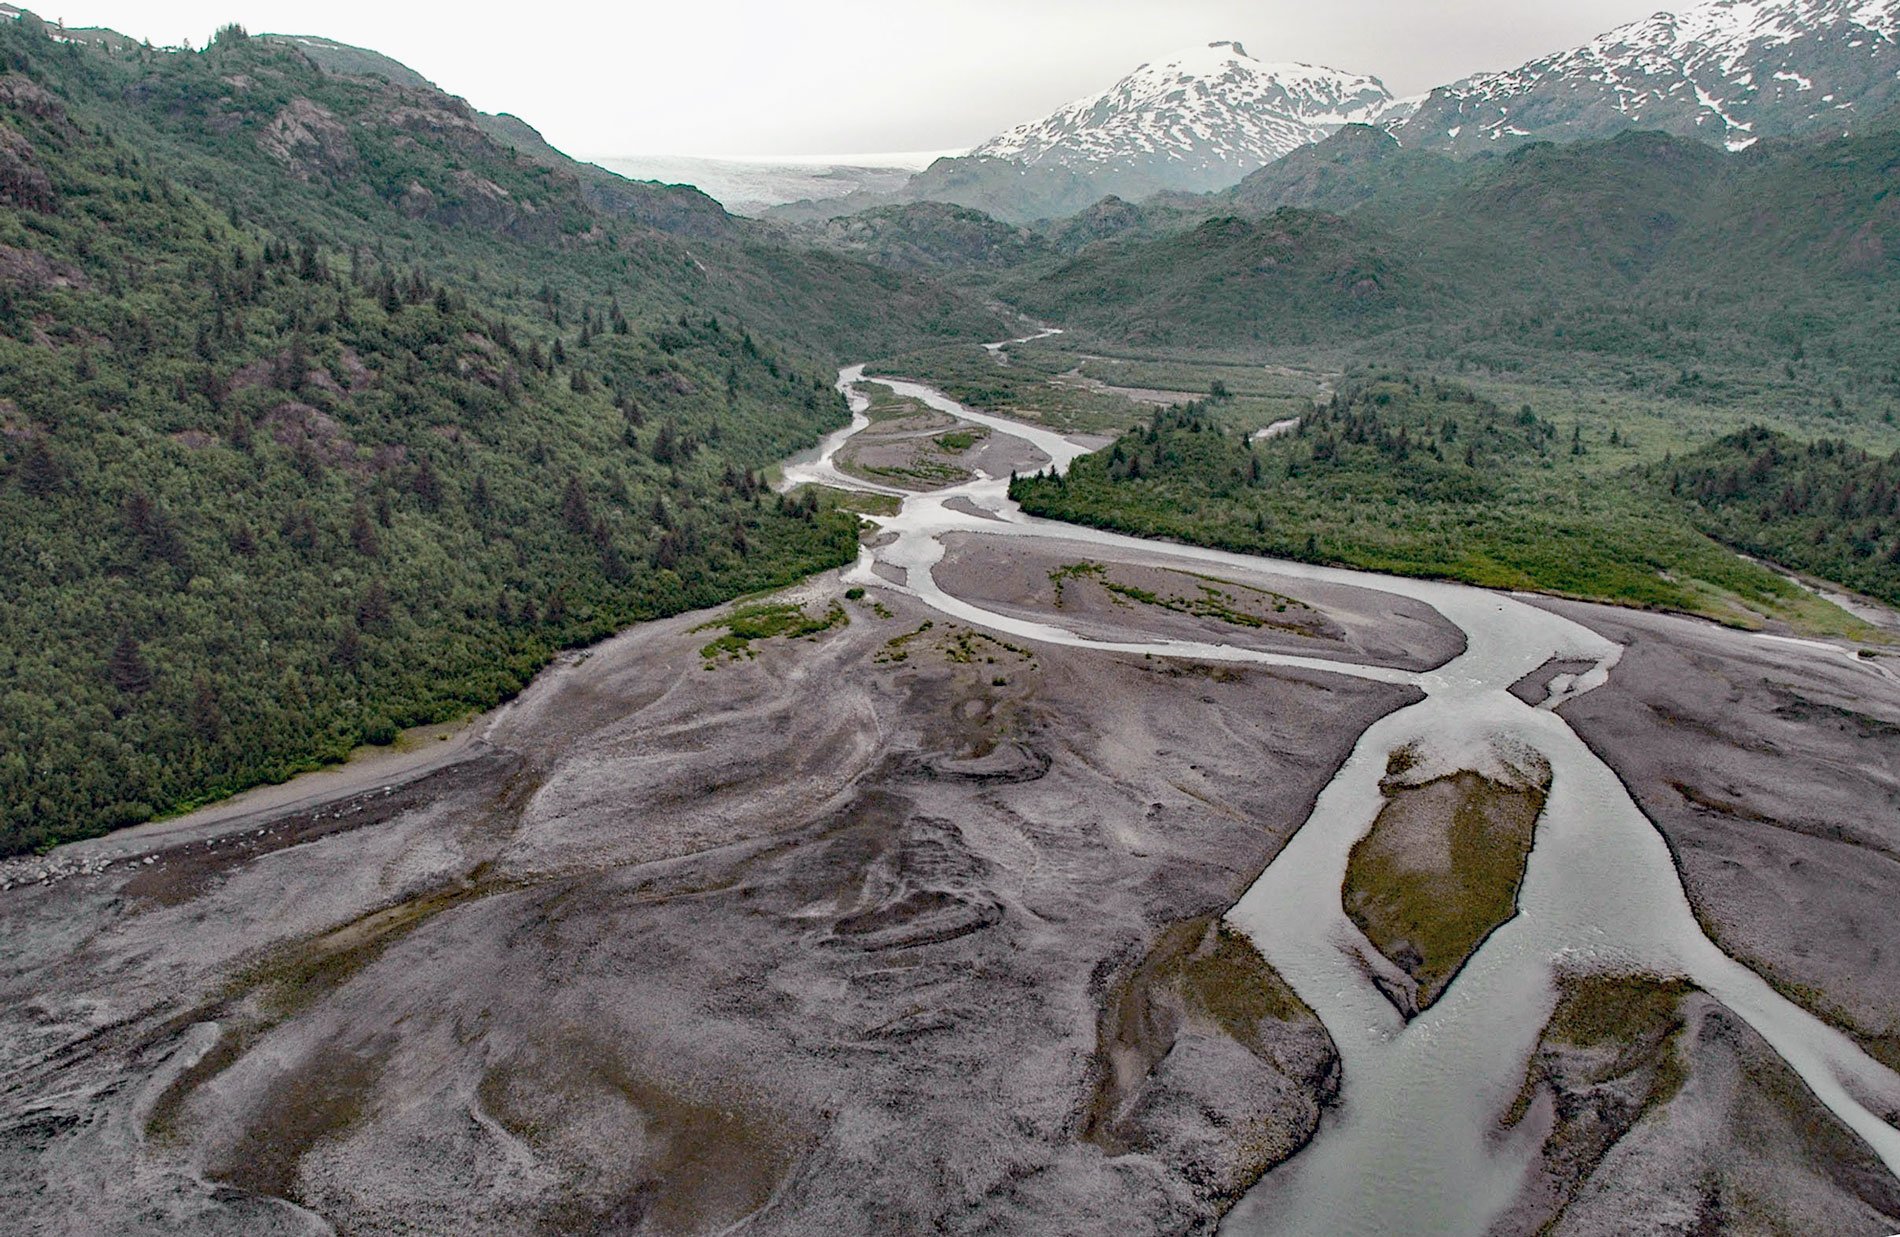
Princeton Glacier is on the east side of the Kenai Peninsula, about 37 miles (60 km) south-southeast of Whittier and 38 miles (61 km) east-northeast of Seward, Alaska. The glacier starts in the Sargent Icefield and then flows southeast for 5 miles (8 km) to its terminus at a lake about 2 miles (3.2 km) north of Nassau Fjord. The glacier was named in 1909 for Princeton University by George Perkins of the U.S. Coast and Geodetic Survey.
Much of the Prince William Sound region is rimmed by mountains dissected by fjords. These fjords were occupied by ice during the Pleistocene until around 10,000 ago, and some glaciers still maintain iceberg calving margins. During the past century, the terminal margins of these glaciers have fluctuated with episodes of glacial advance about 3600 ago, in the 7th century, and most recently between 1300 and 1850, a period known as the Little Ice Age. Records of glacial fluctuations can provide insights into decadal to centennial-scale climate variations and their causes. Research has shown that in many cases a calendar date can be assigned to a glacial advance based on dating trees affected by glacial processes.
The Princeton Glacier valley is currently devoid of living spruce or hemlock older than a few decades; however, abundant subfossil hemlock logs within a kilometer of the 1993 terminus attest to a previously extensive forest. Tree ring aging provides a chronology of the interaction between these forests and glacial activity. The data show that the glacial record of western Prince William Sound over the past 1000 years is remarkably similar on timescales of decades to other glacial histories around the Gulf of Alaska. The tight age control using tree-ring cross-dating allows for the recognition of these synchronous glacial advances and provides a strong basis to compare with other climate proxy data from coastal sites along the Northeast Pacific. Read more here and here. Explore more of Princeton Glacier here:

