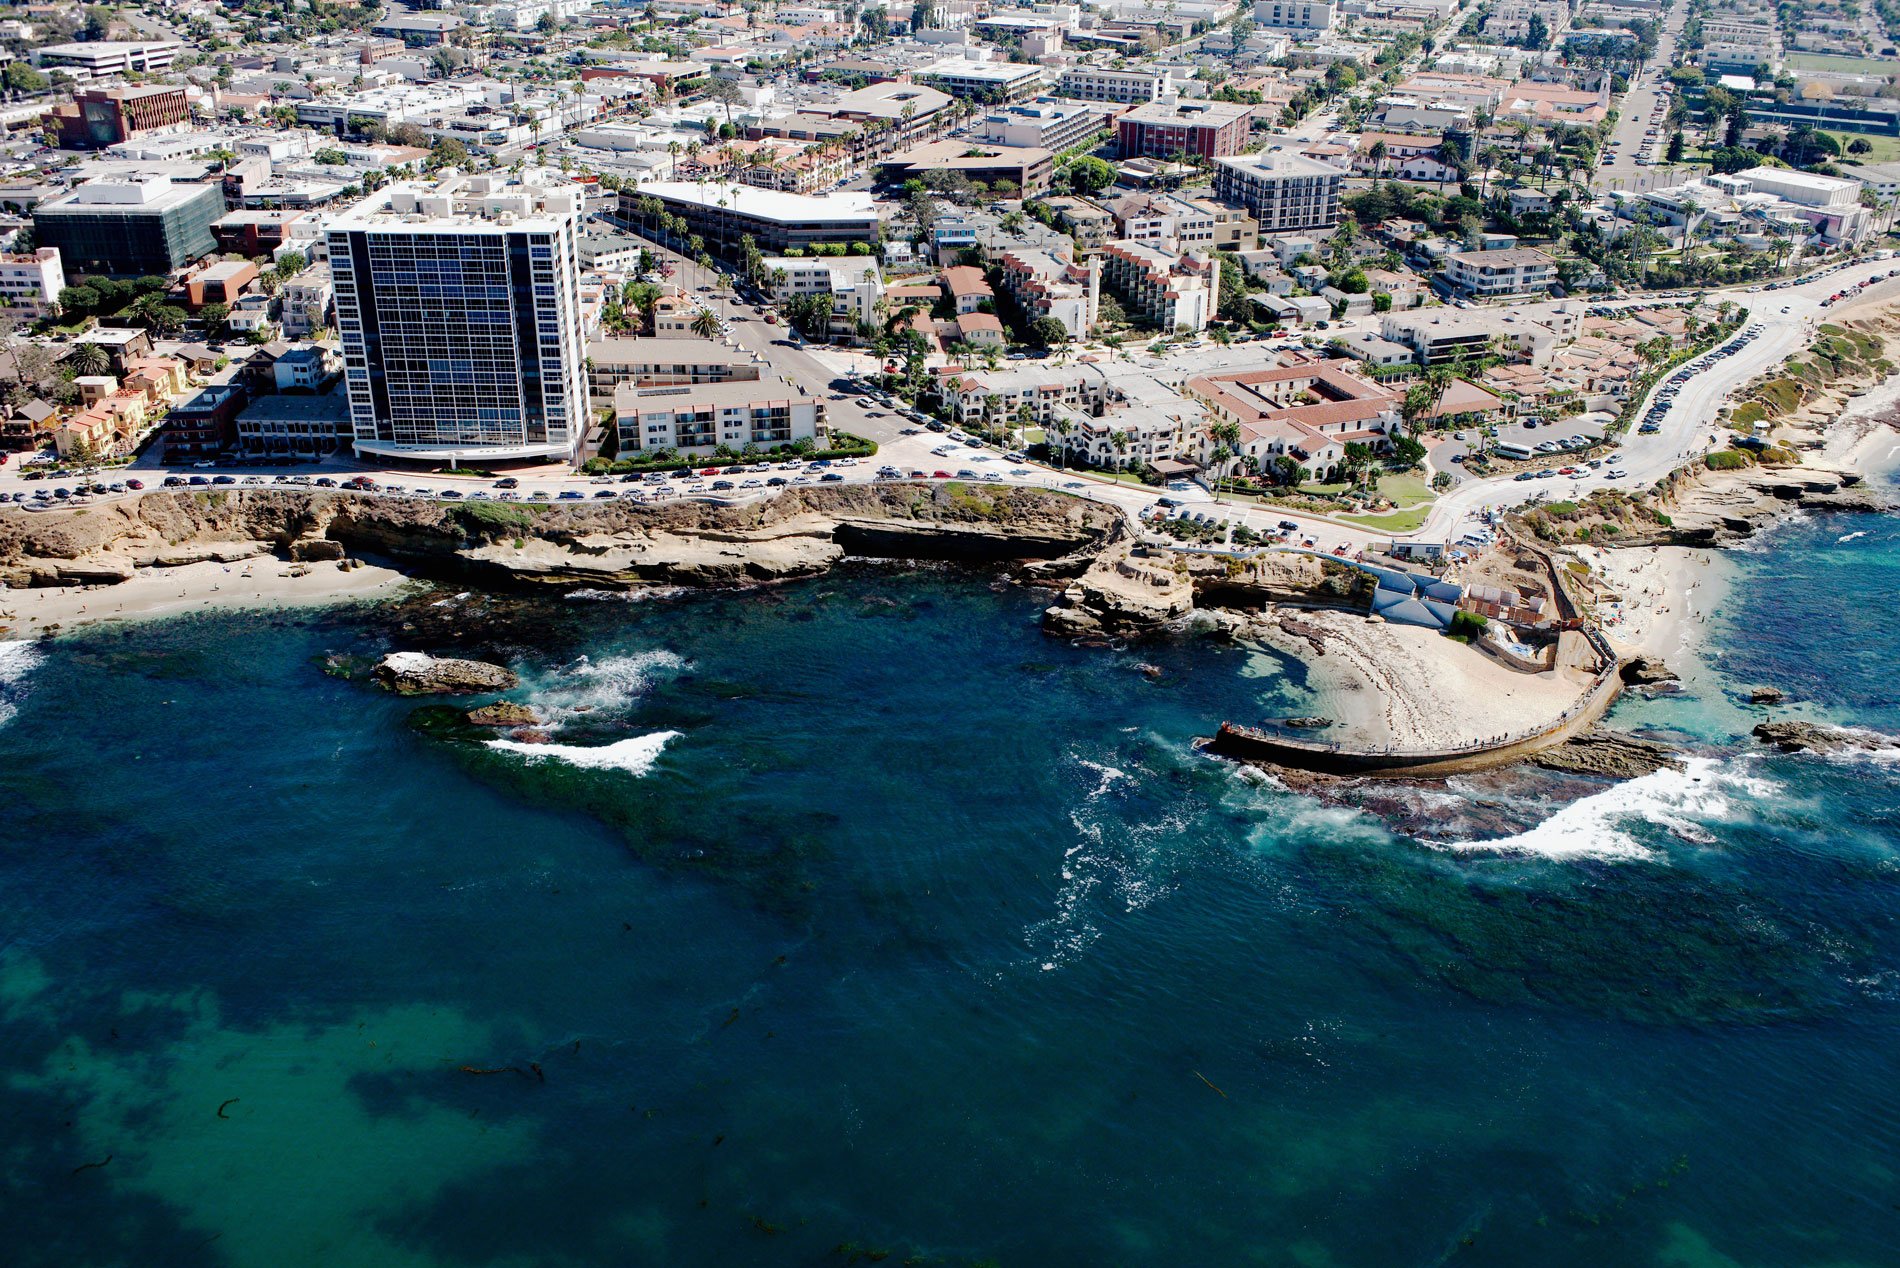
Children’s Pool is one of the many gifts that philanthropist Ellen Browning Scripps gave to the community of La Jolla, located about 13 miles (21 km) south of Encinitas and 11.4 miles (18 km) northwest of San Diego, California. In 1932, a seawall was built to protect the shore from oncoming waves, making it the ideal spot for children to paddle without danger. The concrete breakwater became the setting for a controversial debate 60 years after its completion.
Beginning in the 1870s, tourists and people from San Diego traveled to La Jolla’s coastline for picnics, sunbathing, and afternoons of leisure. However, many of La Jolla’s beaches remained unsafe for swimmers due to the rapid currents. Ellen Browning Scripps, a community resident since 1897, sought a solution to the dangers posed to young swimmers. Scripps devoted much of her time to the welfare and safety of La Jolla’s children. In 1921, Scripps contracted Hiram Newton Savage to engineer a breakwater, and retained architect William Templeton Johnson to design the facility. Construction began in the fall of 1930 and was completed on April 4, 1931.
A colony of harbor seals inhabited the beach in the mid-1990s and by 1999, 100 seals rested at the beach causing San Diego Parks and Recreation to install a rope barrier. The barrier gave the seal habitat a boundary and protected the seals from people. In 2004, the city removed the rope barrier and adopted a “joint use” policy. Because of the overwhelming presence of the seals, swimmers are allowed but highly discouraged from entering the water. Although many of the seals have become accustomed to the presence of humans, the public is encouraged to maintain their distance from the wild animals as they can be aggressive and unpredictable. Read more here and here. Explore more of Children’s Pool here:

