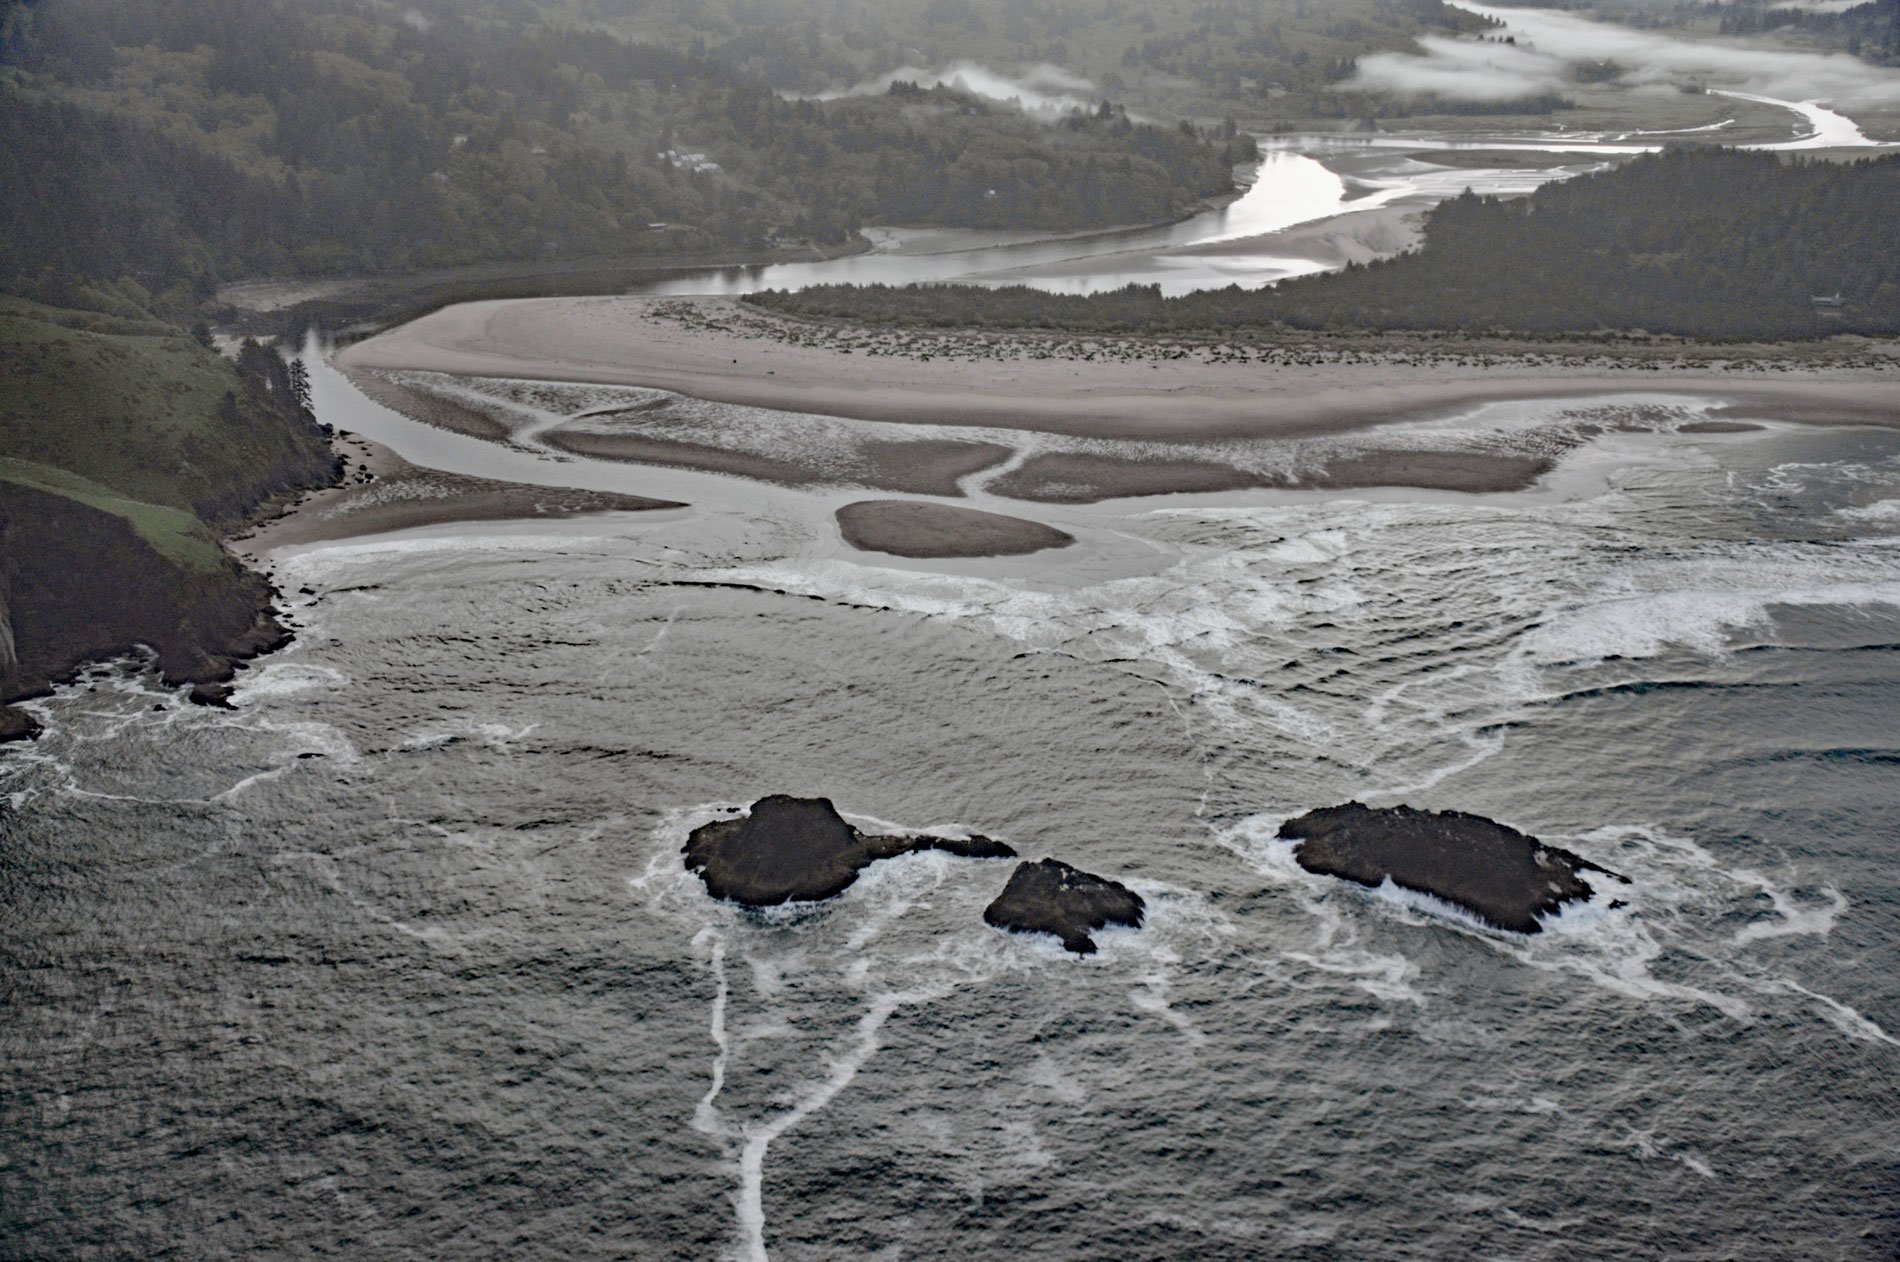
The Salmon River flows for about 24 miles (39 km) from the Central Oregon Coast Range, through the Siuslaw National Forest, to the Pacific Ocean south of Cascade Head, about 73 miles (118 km) southwest of Portland and 6 miles (10 km) north of Lincoln City, Oregon. The river supports populations of wild steelhead and coastal cutthroat trout, as well as Chinook and coho salmon released each year from a hatchery about 4 miles (6.5 km) upstream near Otis.
Scientists have long known that juvenile Chinook salmon reside in estuaries for weeks or months before migrating to sea. Surveys in British Columbia and Washington estuaries in the 1970s showed that many juvenile salmon use tidal marshes as rearing habitat. Most Oregon tidal marshes were diked and converted to pasture for agricultural use long before their importance to salmon and other wildlife was known. The Northwest salmon crisis exposed the failure of fisheries management and drew attention to salmon habitat requirements at different stages of their life cycles.
Although the Salmon River estuary has a long history of human use, most of the major physical alterations started in the mid-1950s. The estuary was ditched and diked and tidegates were installed. By the early 1960s, 75% of the lower Salmon River marsh habitat had been converted to pastures. In 1974, Congress created the Cascade Head Scenic-Research Area. From 1978 to 1996, a series of land acquisitions and intertidal marsh restoration projects were completed on 339 acres (137 ha) of tidal marsh and over 3 miles (4.8 km) of sinuous tidal marsh channels. Gradually, parts of this river, estuary, and nearshore ocean are being restored and protected to secure the needs of wild salmon at different stages in their life cycles. Read more here and here. Explore more of the Salmon River Estuary here:

