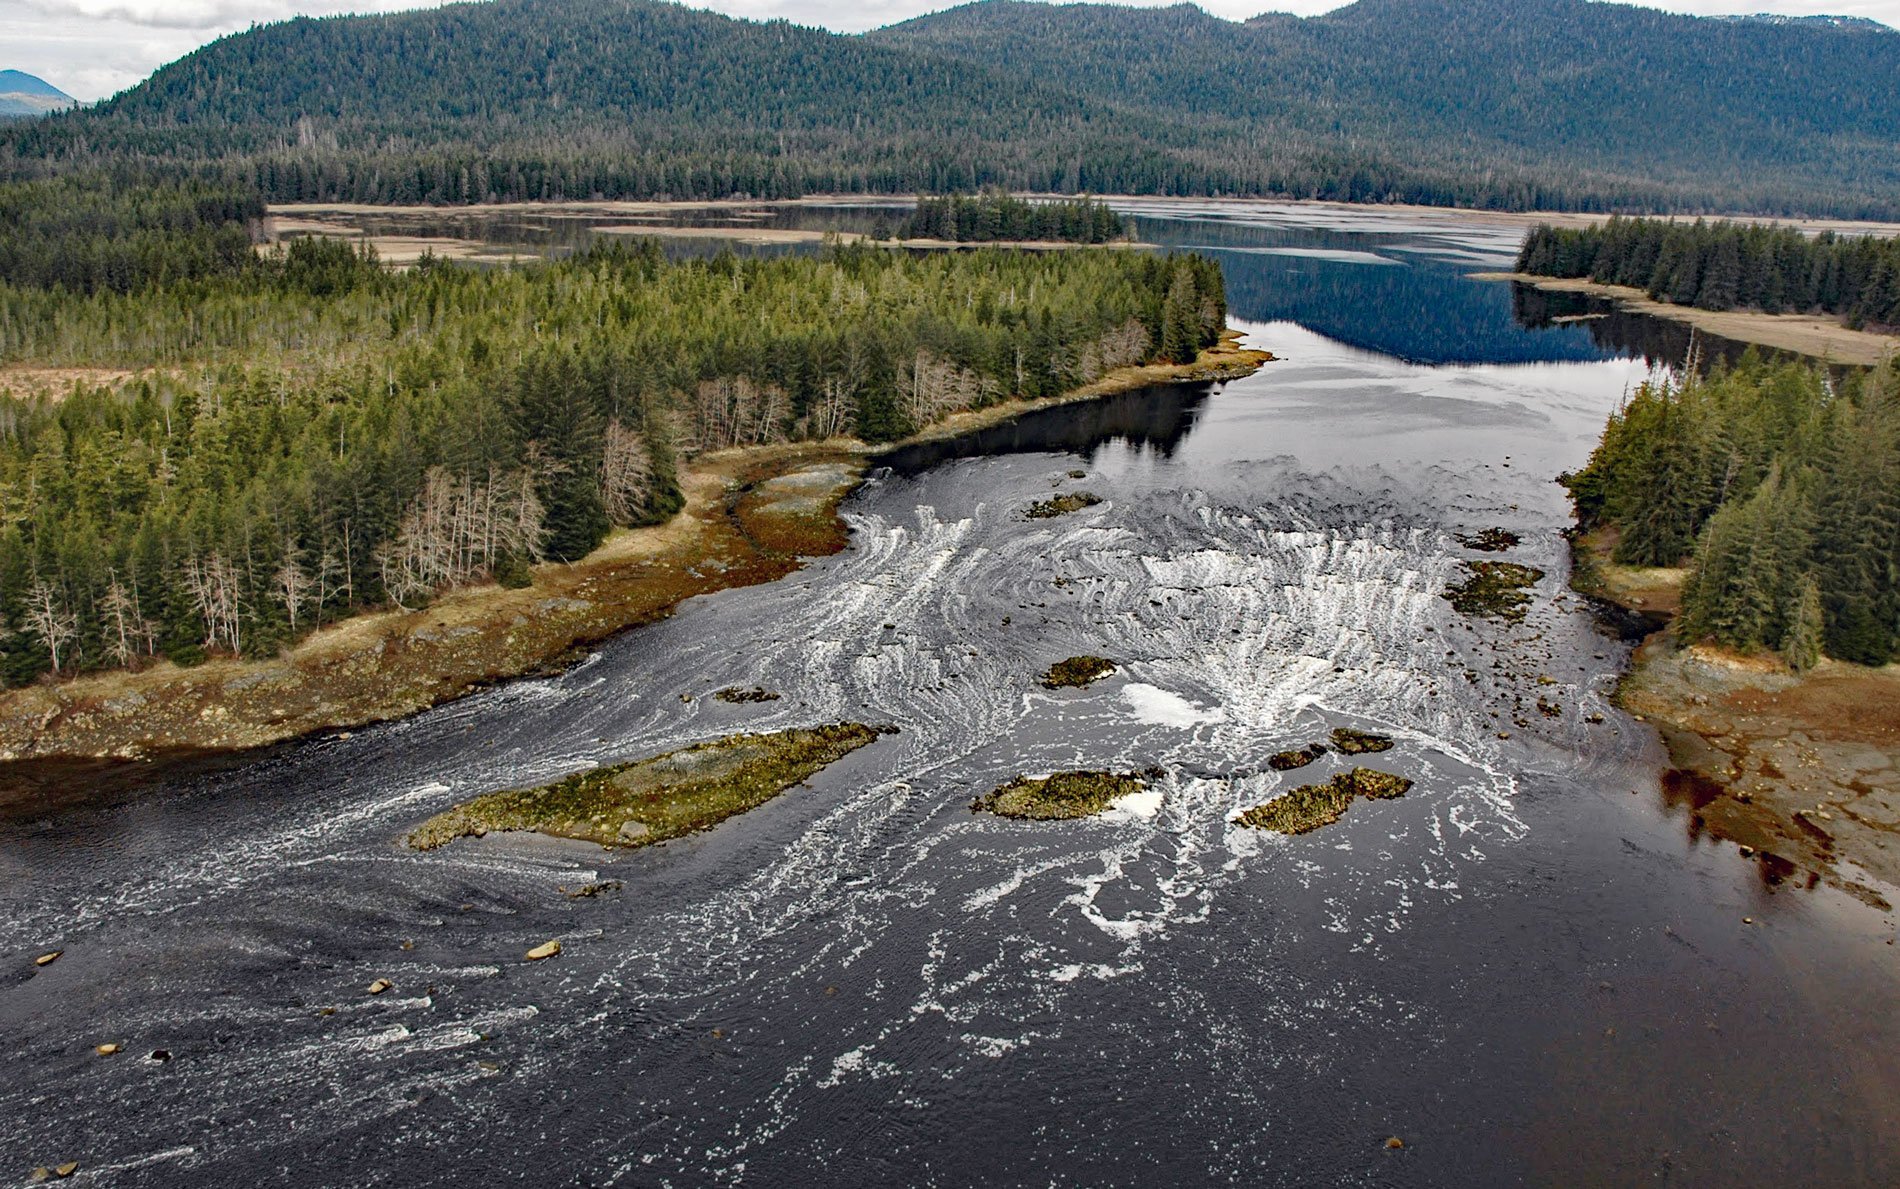
North Arm Salt Chuck is at the head of North Arm, an estuary about 5 miles (8 km) long at the end of Duncan Canal on Kupreanof Island, about 110 miles (177 km) southeast of Juneau and 13 miles (21 km) west of Petersburg, Alaska. The local name was recorded in 1960 by the U.S. Geological Survey. Duncan Canal extends northwest for 22 miles (35 km) from Sumner Strait. The bay was named on August 30, 1793, by Captain George Vancouver of the Royal Navy, for his contemporary, British Admiral Adam Duncan.
A public use cabin is maintained by the Tongass National Forest on North Arm. The Salt Chuck East Cabin is an A-frame with an oil heater, bunk beds, and rowboat. The cabin is located at the south end of the Portage Mountain Loop Trail. This primitive trail is about 4 miles (6.5 km) long and connects North Arm to the head of Portage Bay. The trail follows portions of a historical trail originally cleared by the Civilian Conservation Corps in the early 1930s.
Indian Point is south of North Armin in Duncan Canal and was the site of a radio communication station during the Cold War. The White Alice Communications System was a U.S. Air Force network with 80 radio stations constructed in Alaska. It used tropospheric scatter for over-the-horizon links and microwave relay for shorter line-of-sight links. Sites were characterized by large parabolic, tropospheric scatter antennas as well as smaller microwave dishes for point to point links. The system connected remote Air Force sites in Alaska to command and control facilities in Colorado. The system provided two communication routes from Alaska to the North American Aerospace Defense Command. The A Route went down the southeast coast of Alaska, through the Duncan Canal station, to a submarine cable connecting Ketchikan with Seattle. The B Route went east into Canada. Read more here and here. Explore more of North Arm Salt Chuck here:

