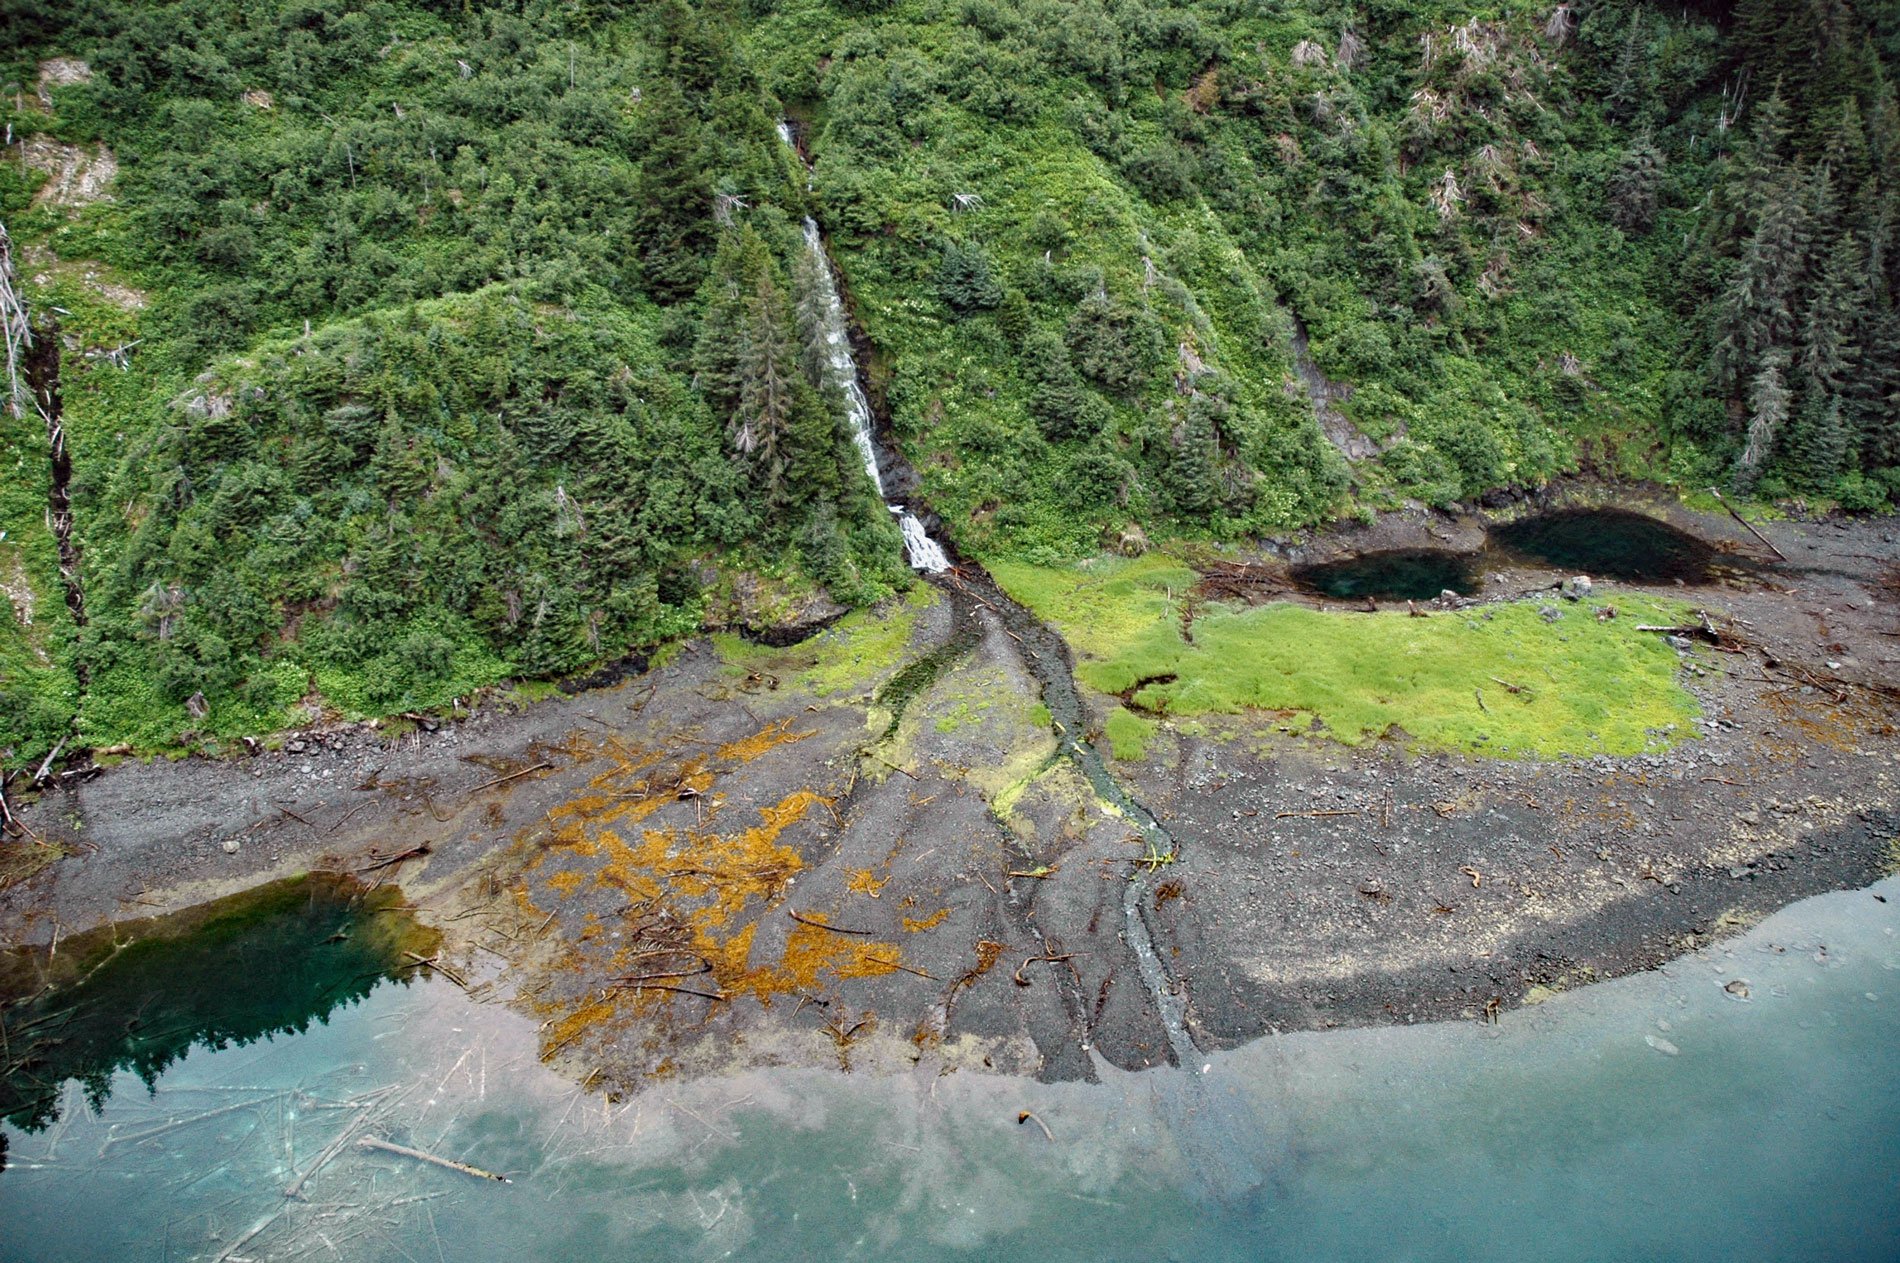
Jackpot Bay is a fjord on the Kenai Peninsula that extends west for 6.5 miles (10.5 km) from Dangerous Passage, about 43 miles (69 km) northeast of Seward and 34 miles (55 km) southeast of Whittier, Alaska. The name was used by fishermen and reported in 1897 by Lieutenant Commander J.F. Moser of the U.S. Navy. Moser commanded the U.S. Bureau of Fisheries steamer Albatross from 1897 to 1901 and made surveys and investigations in western Prince William Sound.
The alluvial fan at the base of the waterfall is an accumulation of sediments eroding from the steep deglaciated slope. Alluvial fans often form where a confined feeder channel exits a mountain front or a glacier margin. As the flow exits the feeder channel onto the fan surface, it is able to spread out which reduces the carrying power of the flow, resulting in the deposition of suspended sediments. Alluvial fans range in area from less than 1 acre (0.4 ha) to thousands of square miles. In deglaciated fjords, sediment deposits are gradually uplifted by post-glacial rebound, elevating the alluvial fans above sea level and allowing terrestrial vegetation to colonize. Fjords located in Prince William Sound are surrounded by steep slopes and receive abundant sediment of highly variable grain size, making them ideal environments to generate submarine landslides and sediment flows.
On March 27, 1964, several fjords, straits, and bays in Prince William Sound experienced significant tsunami runup of localized origin triggered by the Great Alaska earthquake. Dangerous Passage experienced a tsunami that devastated the village of Chenega where 23 of 75 inhabitants perished. In 2014, the U.S. Geological Survey conducted a high-resolution bathymetric survey of this area and found widespread evidence of changes in seafloor depth due to slope failure and landslide generation. The results suggest that a massive unstable sediment accumulation that had developed on the fjordal slope may have failed catastrophically during the earthquake, generating a tsunami that inundated Chenega. Read more here and here. Explore more of Jackpot Bay here:

