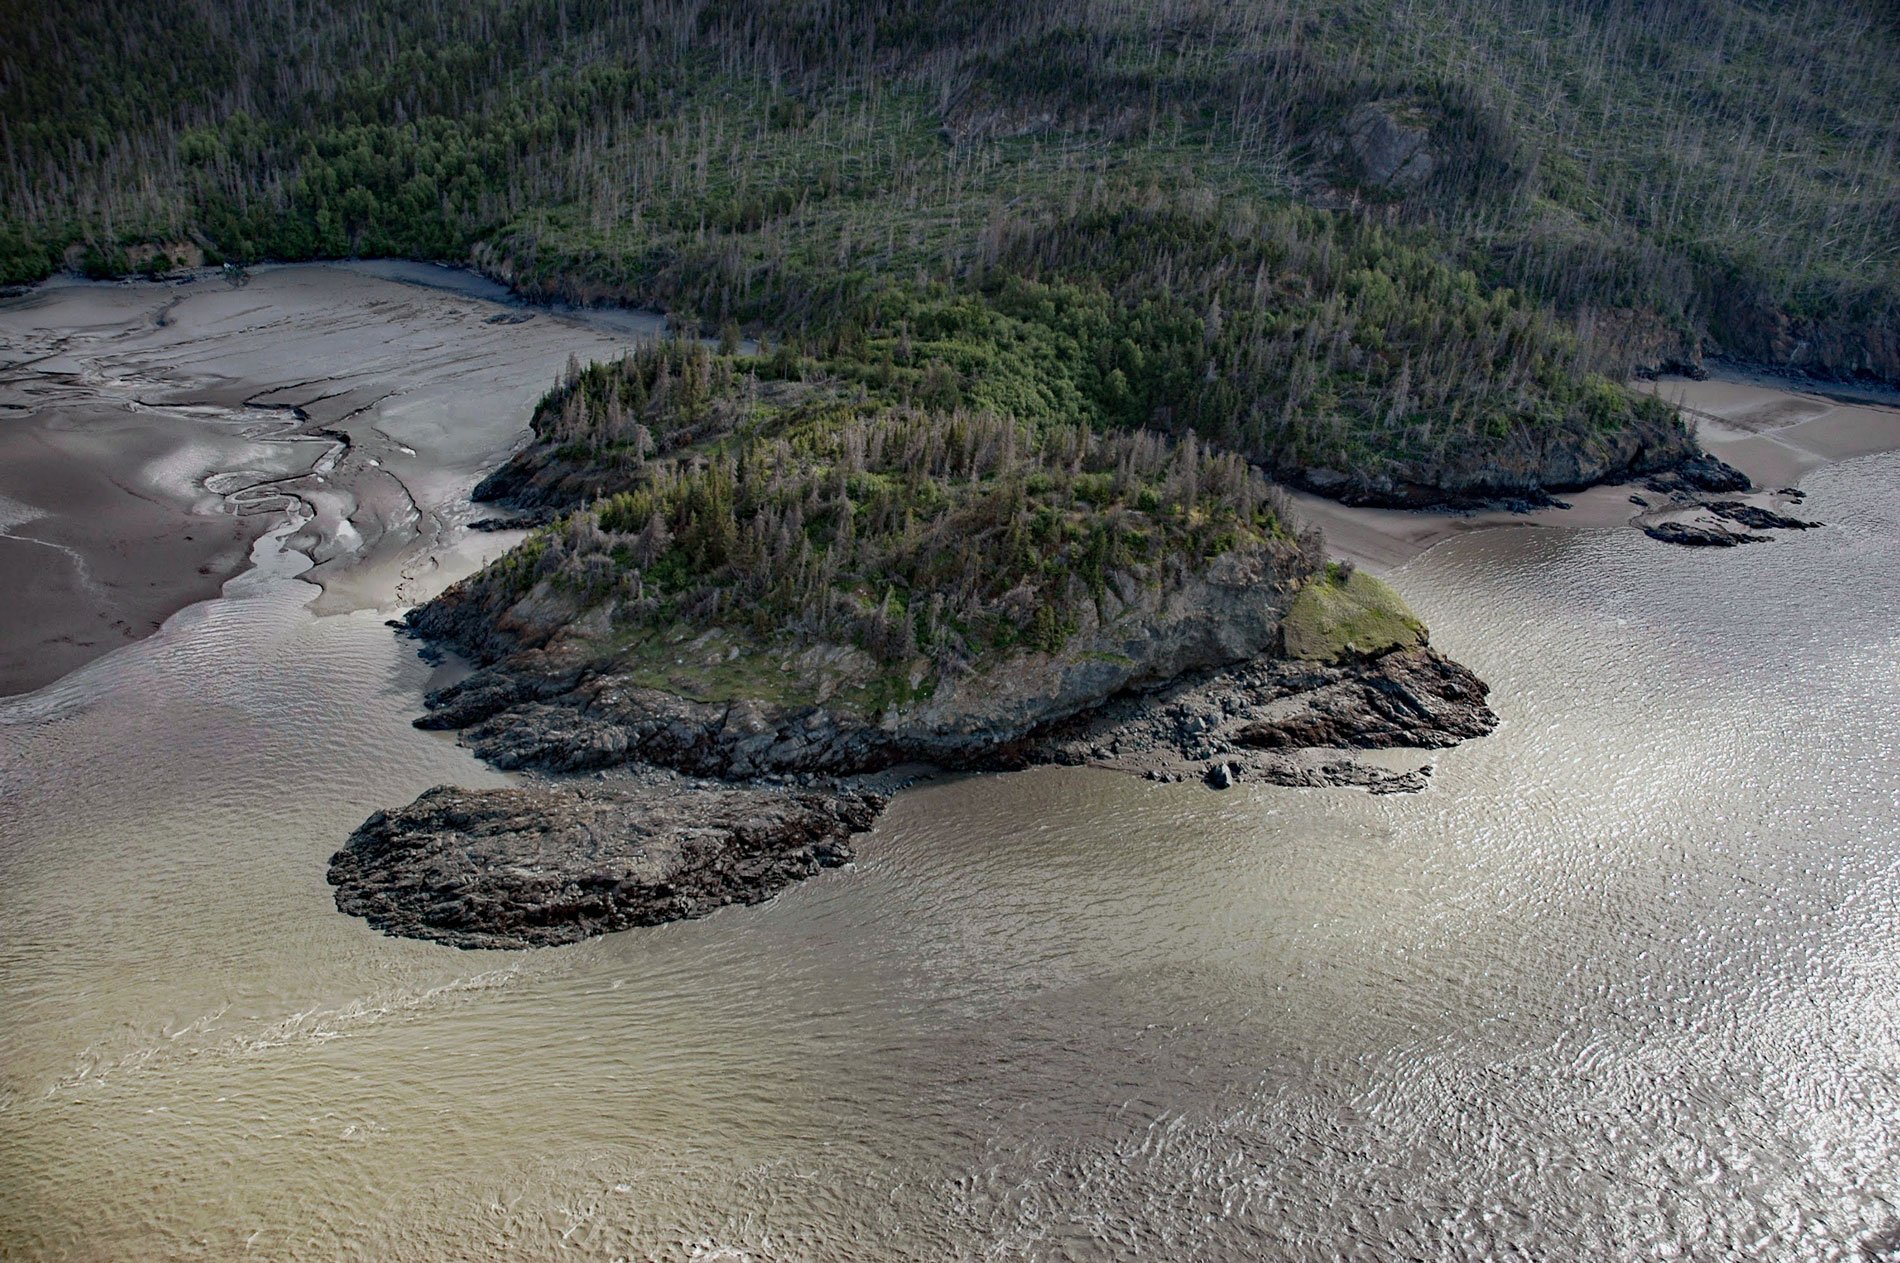
Gull Rock is a point of land on the south shore of Turnagain Arm on the Kenai Peninsula, about 18 miles (29 km) south-southeast of Anchorage and 6 miles (10 km) northwest of Hope, Alaska. The name was first published in 1943 by the U.S. Coast and Geodetic Survey. Johnson Creek exits the Kenai Mountains at Gull Rock and at low tide flows across the mudflats through an incised channel.
In 1914, Frederick Mears, a career Army officer and civil engineer, was put in charge of surveying and construction of the Alaska Railroad for the U.S. Government. Mears commanded an army of civilian workers and contractors, which at the peak of construction numbered 4500. Except for what could be utilized of the existing shortline railroads, everything needed for a major railroad had to be created from scratch including rail yards and depots, machine and repair shops, housing for workers, hospitals, power plants, and sawmills for converting tree trunks into cross-ties. Modern docks had to be built at Seward on the south coast and at Ship Creek, a small village at the head of Cook Inlet which would soon be re-named Anchorage.
Hope was already a thriving community of miners working the local creeks and arriving from Seattle to venture into the interior. A sawmill was located on Johnson Creek at Gull Rock, and a primitive road followed the shoreline from Hope. The road followed an ancient Dena’ini trail that connected with a village on Chickaloon Bay. The sawmill cut rail ties that were boated across Turnagain Arm to support the building of the Alaska Railroad. The mill later sawed timbers and lumber for mining and construction. In the 1940s, Dick Turpin owned and operated the sawmill, but it was abandoned in 1947. Today, the road is a popular recreational hiking trail and remnants of the sawmill may still be found at the mouth of Johnson Creek. Read more here and here. Explore more of Gull Rock here:

