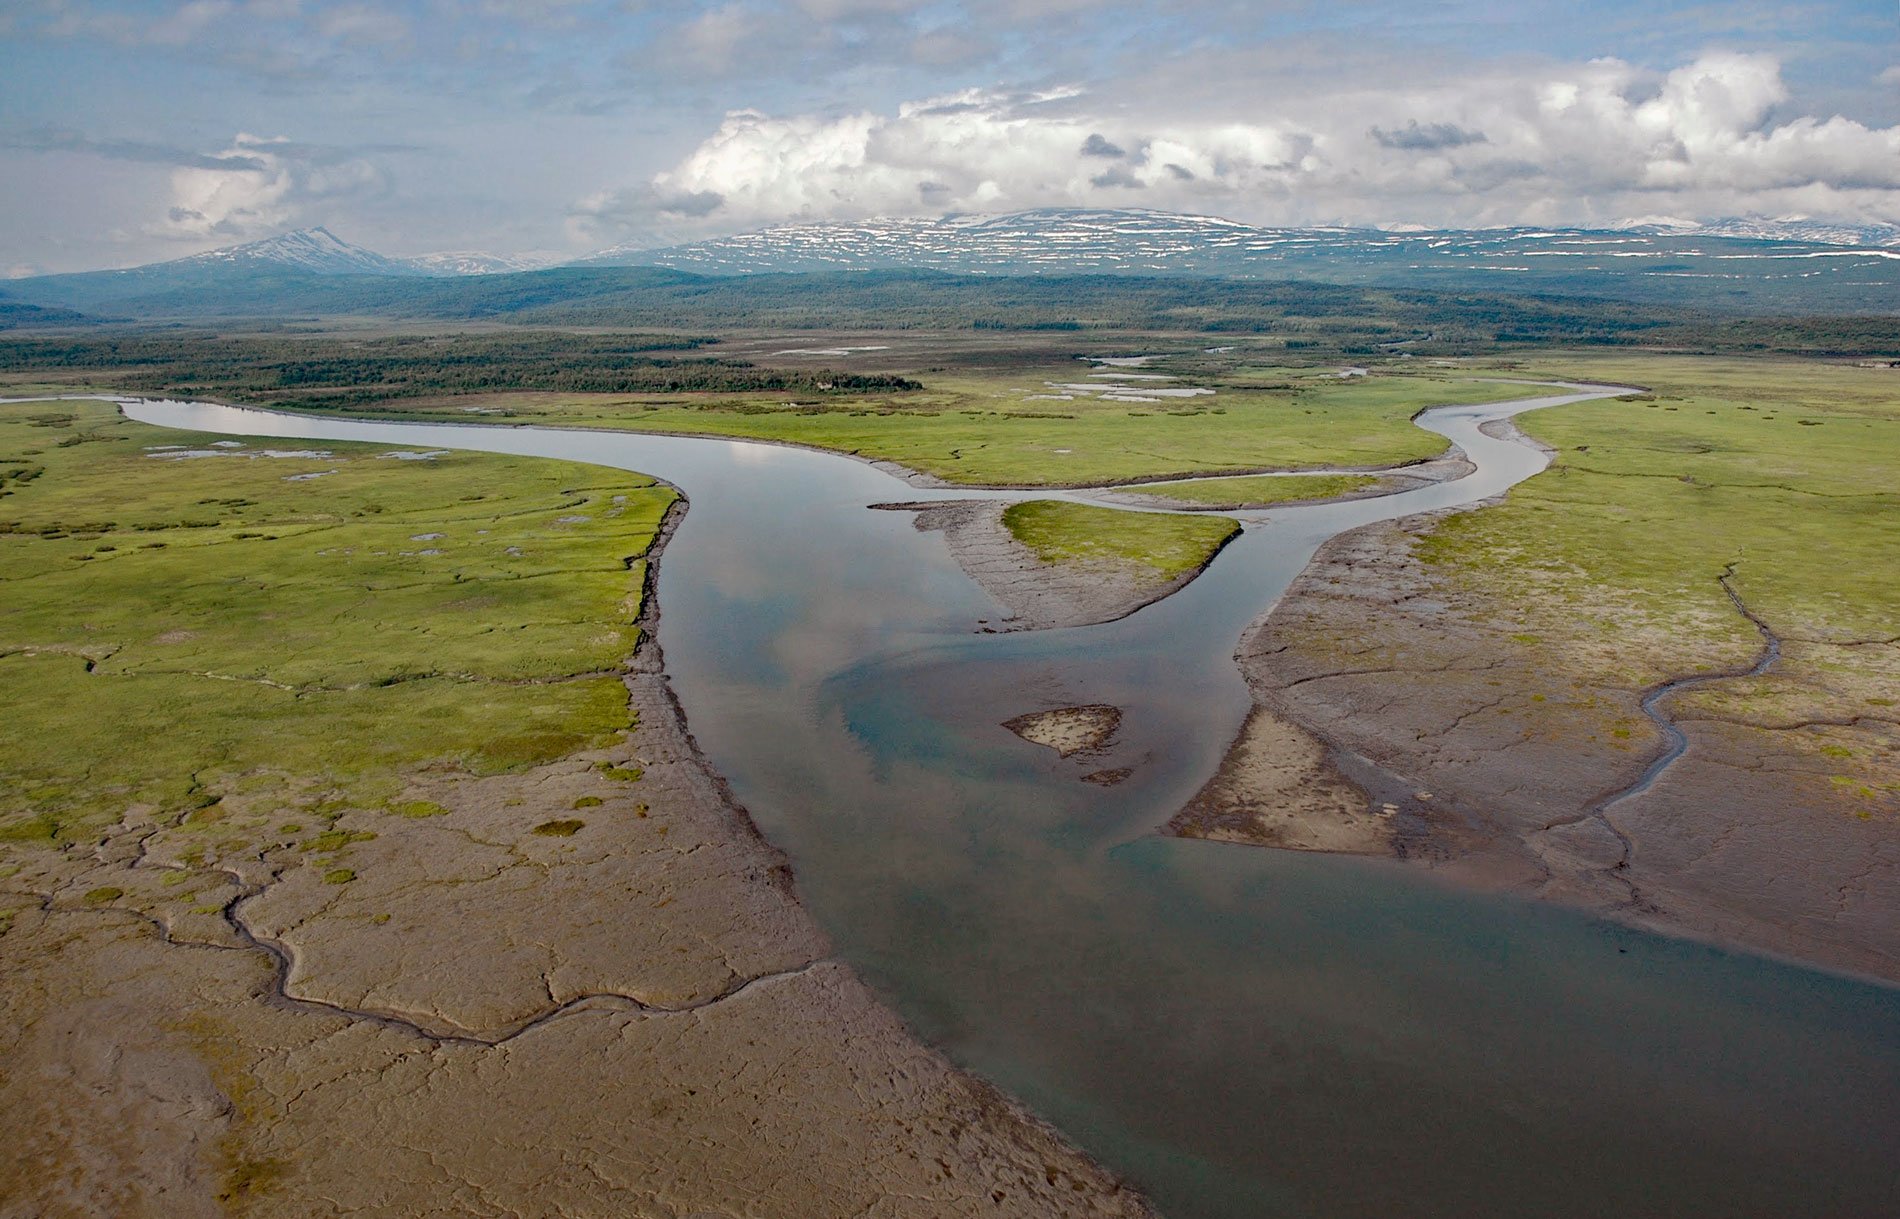
Kamishak River starts from an unnamed lake at an elevation of 2,700 feet (823 m) in a saddle between two peaks in the Aleutian Range and first flows southeast for 10 miles (16 km) and then north-northeast for 28 miles (45 km) through Katmai National Park and Preserve to Akumwarvik Bay, about 104 miles (168 km) southwest of Homer and 93 miles (150 km) east-northeast of King Salmon, Alaska. The Kamishak River is joined by the South Fork Kamishak River at Mile 27 and the Little Kamishak River at Mile 37, near Akumwarvik Bay. The Sugpiaq Alutiiq name was first published in 1826 by Lieutenant Gavril Sarychev of the Imperial Russian Navy as ‘Reka Kamyshak’, or ‘Kamyshak River’.
Akumwarvik Bay extends south-southwest for 5 miles (8 km) off Kamishak Bay on the Cook Inlet coast of the Alaska Peninsula. The name of the bay was reported in 1923 by Kirtley F. Mather, a petroleum geologist contracted to the U.S. Geological Survey. In 1920, the U.S. Congress opened the Alaska territorial public lands to oil prospecting, and development interests responded by filing oil leases in any areas in which the U.S. Geological Survey had shown petroleum potential. Oil seeps had been discovered on the shoreline of Kamishak Bay and as a result, leases were scattered along the bay’s southwestern shore and up to 10 miles (16 km) upstream on the Kamishak River. However, no drilling ever took place on the margins of Kamishak Bay, and the oil leases were eventually canceled.
The mouth of the Kamishak River was once the site of a trapper’s cabin. In 1929, the brothers Walter and Ole Wassenkari ran trap lines in the winter and Ole Wassenkari lived in a cabin at the mouth of the Kamishak River. The exact location of the cabin is not known and no evidence of the structure has ever been found. The cabin may have been built during the oil-lease activity in the early 1920s and later used opportunistically by the trappers. Read more here and here. Explore more of Kamishak River here:

