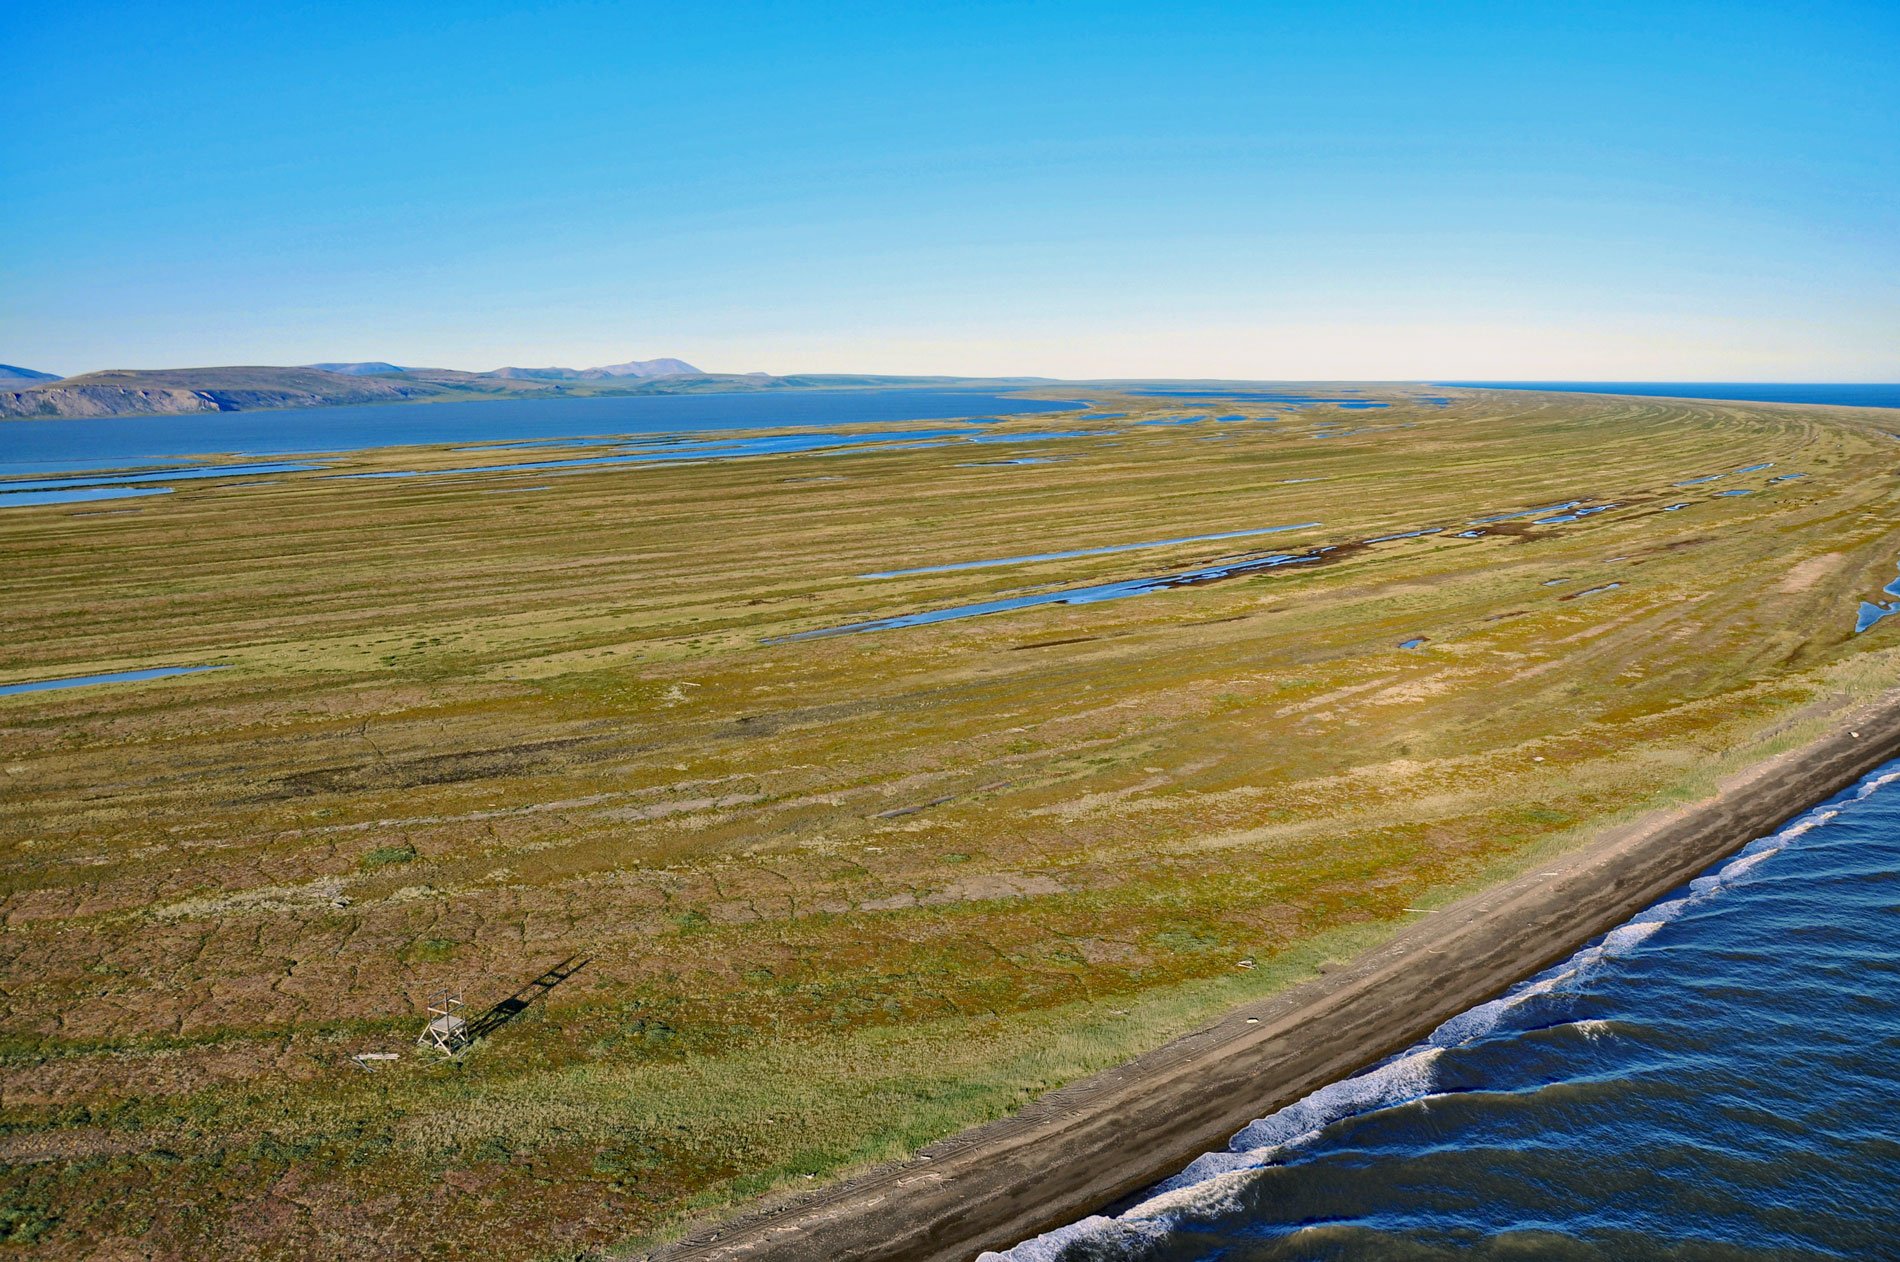
A sealing observation tower used seasonally by Iñupiat hunters is at the tip of Cape Krusenstern, about 48 miles (77 km) southeast of Kivalina and 35 miles (56 km) northwest of Kotzebue, Alaska. Observation towers are used for locating open water where seals congregate, and for locating reindeer herds and game on the beach ridge complex. This place is called Napaaksaq by the Iñupiat. Cape Krusenstern is a point of land on the Chukchi Sea in Cape Krusenstern National Monument at the entrance to Kotzebue Sound. The cape was named on August 14, 1816, by Lieutenant Otto von Kotzebue of the Imperial Russian Navy for Admiral Adam Johann von Krusenstern, who was the first Russian circumnavigator in 1803-04.
Cape Krusenstern consists of a series of 114 beach ridges and swales with numerous ponds and lakes. The beach ridges are formed by the onshore migration of submerged offshore bars during storm surges in which sea level is temporarily raised in response to lowered barometric pressure and strong onshore winds. Temporary rises in sea level as great as 13 feet (4 m) have been recorded during storm surges along the shores of the Chukchi and Bering Seas. The accretion of a beach ridge and its ultimate elevation is governed by the height of sea level during the storm surge, by the intensity of wave attack, and by the volume of sediment that has accumulated nearshore.
In the 1960s, extensive archaeological excavations by J.L. Giddings and co-workers have made Cape Krusenstern a major archaeological resource containing a more or less complete history of coastal occupation during the past 5,000 years. Because the aboriginal maritime economy required that communities locate as close as possible to the beach, the individual beach ridges at Cape Krusenstern can be approximately dated. The archaeological studies have also provided valuable historical information on coastal processes and the evolution of the Cape Krusenstern beach-ridge complex. Read more here and here. Explore more of Sealing Point here:

