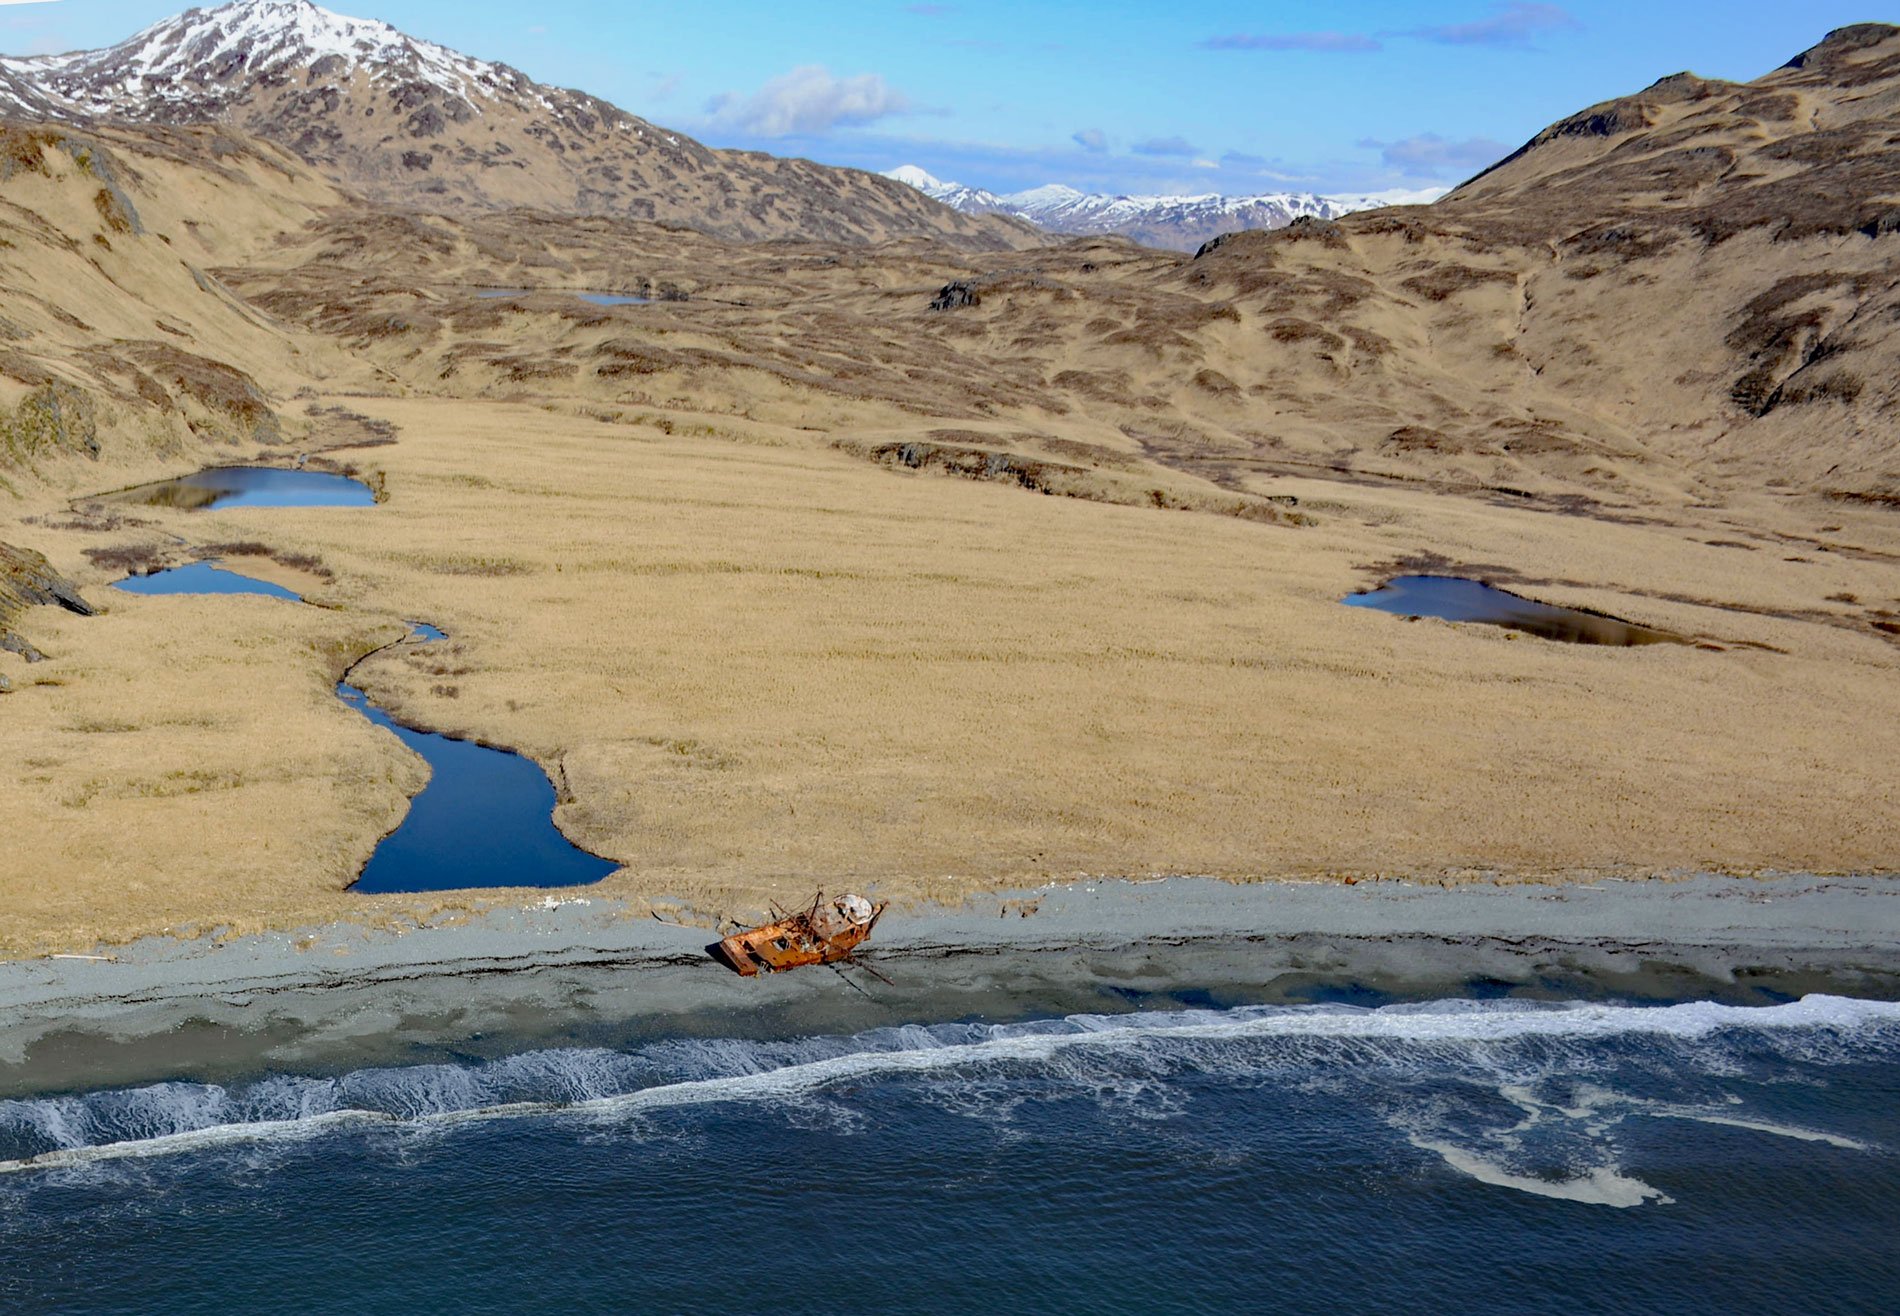
Stardust Bay is on the southeast coast of Sedanka Island, about 780 miles (1258 km) southwest of Anchorage and 16 miles (26 km) southeast of Dutch Harbor, Alaska. Stardust Bay is named for a fishing vessel that wrecked on the steep high-energy beach at the head of the bay. The funnel-shaped embayment is exposed to the full force of waves from the Gulf of Alaska. This bay is the site of an ongoing study by the U.S. Geological Survey of very large tsunamis.
Sedanka Island is about 11 miles (18 km) long and located in the Fox Islands, off the northeast coast of Unalaska Island in the Eastern Aleutians. In 1792, Lieutenant Sarichev of the Imperial Russian Navy named the island “Spirkin”, but that same year Martin Sauer gave the Aleut name “Sithanak” which Marcus Baker recorded “Siginak” meaning “braided” or “curled”. The U.S. Coast and Geodetic Survey named the island “Sedanka” on charts from 1921. Sedanka is uninhabited, but an Aleut village called Biorka was on the north coast until 1942 when it was evacuated during World War II and later abandoned.
Core samples and shallow pits have revealed a series of sand deposits from historical tsunamis that reached 0.5 miles (800 m) inland. Drift logs ringing the lowland floodplain approximate the landward limit of the most recent tsunami. The highest log found (a 10 m long by 0.25 m diameter pole) was nearly 0.6 miles (1 km) inland, bridging a narrow gully at an elevation of 60 feet (18.5 m). The drift logs came from Stardust Bay’s shoreline because driftwood litters the beach and, like other Aleutian islands, no trees grow on Sedanka Island. The evidence suggests that intervals between historical tsunamis were as short as 170 years and as long as 570 years. On average, tsunamis of the past 1700 years inundated Stardust Bay every 300–340 years. Read more here and here. Explore more of Stardust Bay and Sedanka Island here:

