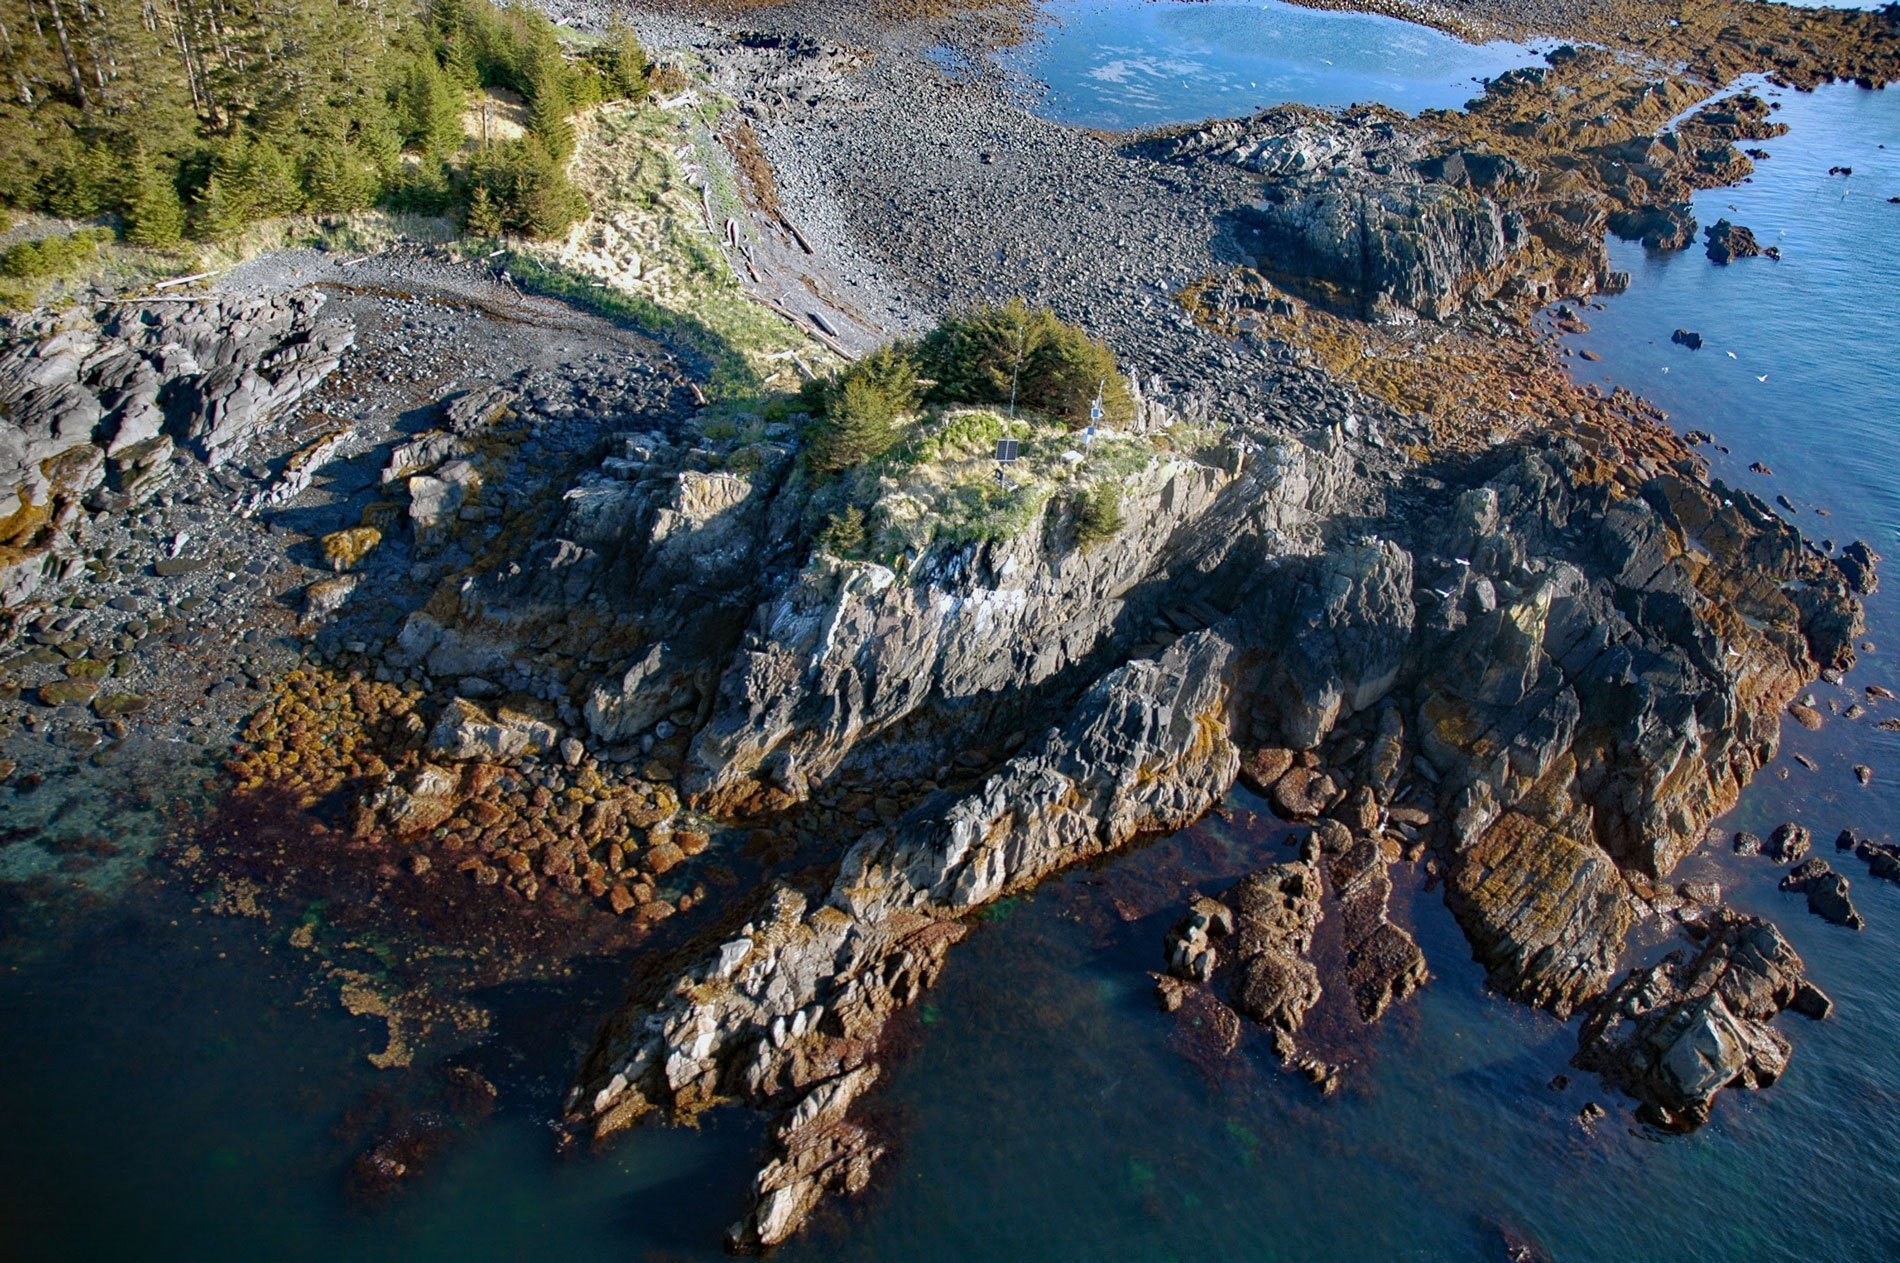
Seal Island is forested and uninhabited, about 0.5 miles (0.8 km) across, and located in Prince William Sound, about 7 miles (11 km) east of Knight Island, and 58 miles (93 km) west-southwest of Cordova, Alaska. The name was first published in 1899 by the U.S. Coast and Geodetic Survey. The island is presumably named for the common harbor seal, the most widely distributed species of pinnipeds found in coastal waters, and historically a mainstay of the diet for the Alutiiq villages of Tatitlek, Chenega Bay, Eyak, and Nuchek.
Seal Island was one of the most heavily impacted islands in Prince William Sound following the Exxon Valdez Oil Spill. Field reports from July 1989, 3 months after the spill occurred, noted pooled oil and stretches of greasy brown emulsion over 2 feet (0.7 m) deep stranded on the shoreline. So much oil was stranded on the island that it became a major source of on-water oil long after the initial oil spill. Every high tide would wash stranded oil back into the water. To stop this endless cycle, the U.S. Coast Guard approved an intensive shoreline cleanup effort followed by bioremediation.
Seal Island is now the site of a weather station that transmits data as part of the Hydrometeorological Automated Data System, a network of real-time data acquisition stations operated and distributed by the National Weather Service. The weather station is augmented by a precipitation gage that is part of the snow telemetry system operated by the Natural Resources Conservation Service. There are seven precipitation stations in the Prince William Sound network including Esther Island, Tatitlek, Mount Eyak, Strawberry Reef, Nuchek, Port San Juan, and Seal Island. These weather stations provide information necessary for more accurate weather forecasts and ocean circulation modeling. Read more here and here. Explore more of Seal Island here:

