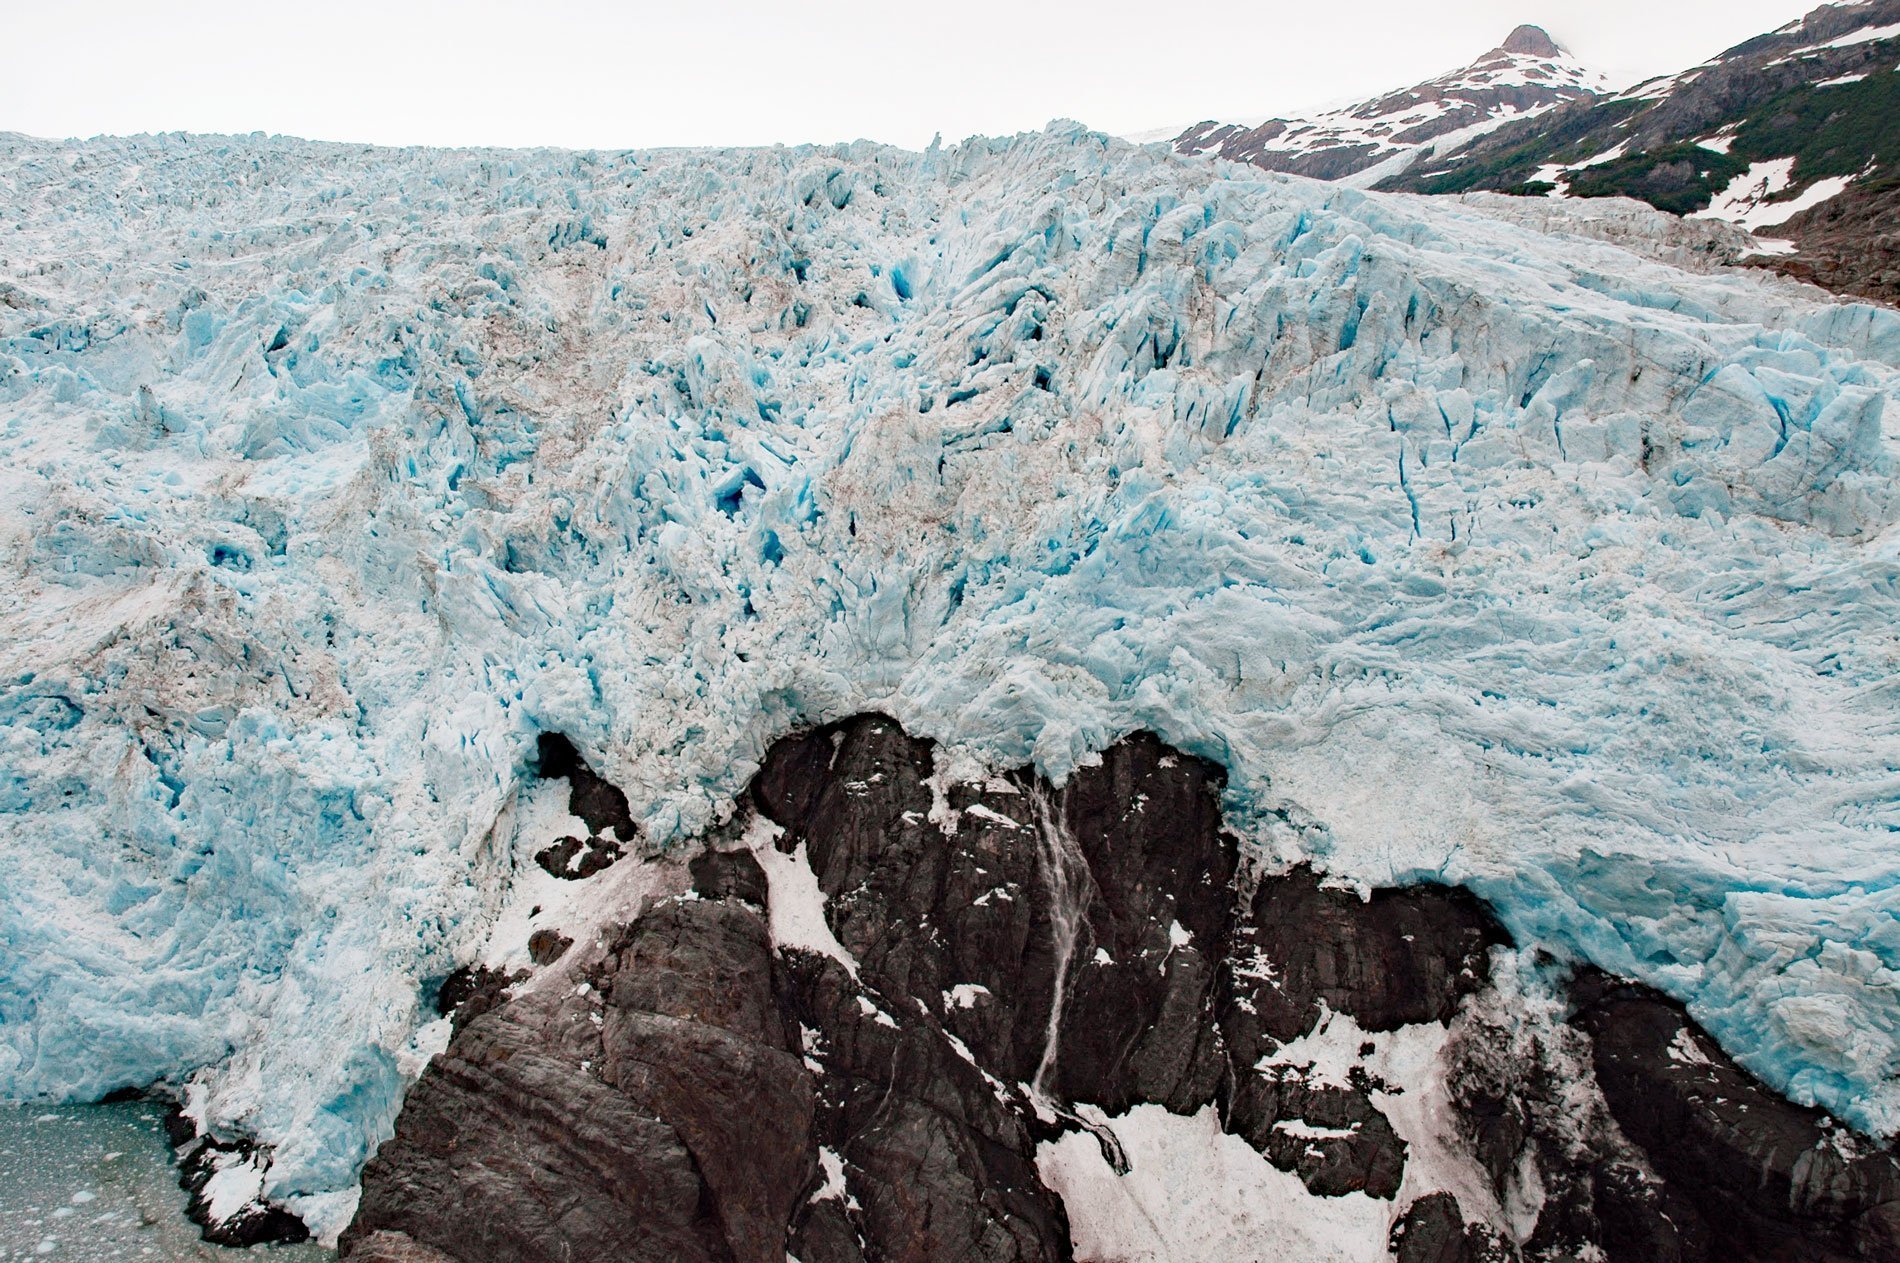
Tiger Glacier starts at an elevation of 5,400 feet (1,646 m) in the Sargent Icefield on the Kenai Peninsula and flows east for 8 miles (13 km), covering an area of 15,040 acres (6,090 ha), to a tidewater terminus about 0.5 miles (0.8 km) wide at the head of Icy Bay in Prince William Sound, about 98 miles (158 km) southwest of Valdez and 42 miles (68 km) east-southeast of Whittier, Alaska. Most of the snow accumulation occurs above an elevation of 2,500 feet (762 m). The glacier was named in 1908 by Ulysses S. Grant and Daniel F. Higgins of the U.S. Geological Survey during a quick survey of the glaciers in Icy Bay. Icy Bay is a fjord that extends southwest for 12 miles (19 km) from Dangerous Passage along the western coast of Prince William Sound. The bedrock exposed by the retreating glaciers surrounding Icy Bay comprises sedimentary rocks of the Orca Group which is part of the Southern Margin composite terrane, a Cretaceous to Tertiary subduction-related accretionary wedge and one of the world’s largest accretionary complexes. The rock is mostly greywacke sandstone, siltstone, mudstone, slate, and conglomerate that indicate deposition on a submarine fan in a deep ocean trench by turbidity currents.
Icy Bay was first explored on June 4, 1794, by Lieutenant Joseph Whidbey who was a member of Captain George Vancouver’s expedition, and it was subsequently named by Vancouver but not shown on his charts. In 1794, it is likely that the glaciers in Nassau Fjord, a large bay on the northwest side of Icy Bay extended into, but not across, the main part of Icy Bay. This, together with the extensive discharge of ice from these glaciers that were at that time combined into one ice front, probably prevented close inspection of Icy Bay and the discovery of its upper part. The subsequent errors in mapping arose from Vancouver’s representation of Icy Bay that were copied in later maps; however, he had reported that the bay was ‘terminated by a compact body of ice that descended from high perpendicular cliffs to the waterside’. Tiger Glacier retreated about 7 miles (11 km) between 1794 and 1908 and in the process disintegrated into several separate ice streams including Princeton, Chenega, and Tigertail glaciers that retreated into Nassau Fjord. In 1908, Grant observed exposed rock in front of Tiger Glacier, but this rock was subsequently covered by an ice advance and was not seen again until 2000.
Between 1935 and 1957, the movement of the Tiger Glacier terminus was minimal, and mature spruce trees less than a mile from the terminus indicate that the glacier did not expand like other area glaciers. Since about 1960, the terminus retreated, and in 2000, the ice was at about the same location as it was in 1908. The glacier terminus is now a combination of the Tiger Glacier flowing from the west and an unnamed glacier flowing into Icy Bay from the southwest. Tidewater glaciers terminate in the ocean at either a grounded terminus or a floating ice front. In 1975, Austin Post described the ‘tidewater glacier cycle‘ where glaciers slowly advance over the course of centuries, until thinning near the terminus initiates a rapid retreat that completes within decades, stabilizing only when the glacier has retreated into shallow water. In general, the retreat phase of a tidewater glacier can be triggered by changes in climate, but once the retreat is initiated, the rate of retreat is only weakly influenced by climate, and glacier geometry becomes a primary driver of behavior. The ability of tidewater glaciers to discharge large amounts of ice in a short period of time highlights their potential hazard to shipping traffic in nearby waters, as well as their potential importance to sea level rise. Read more here and here. Explore more of Tiger Glacier and Icy Bay here:

