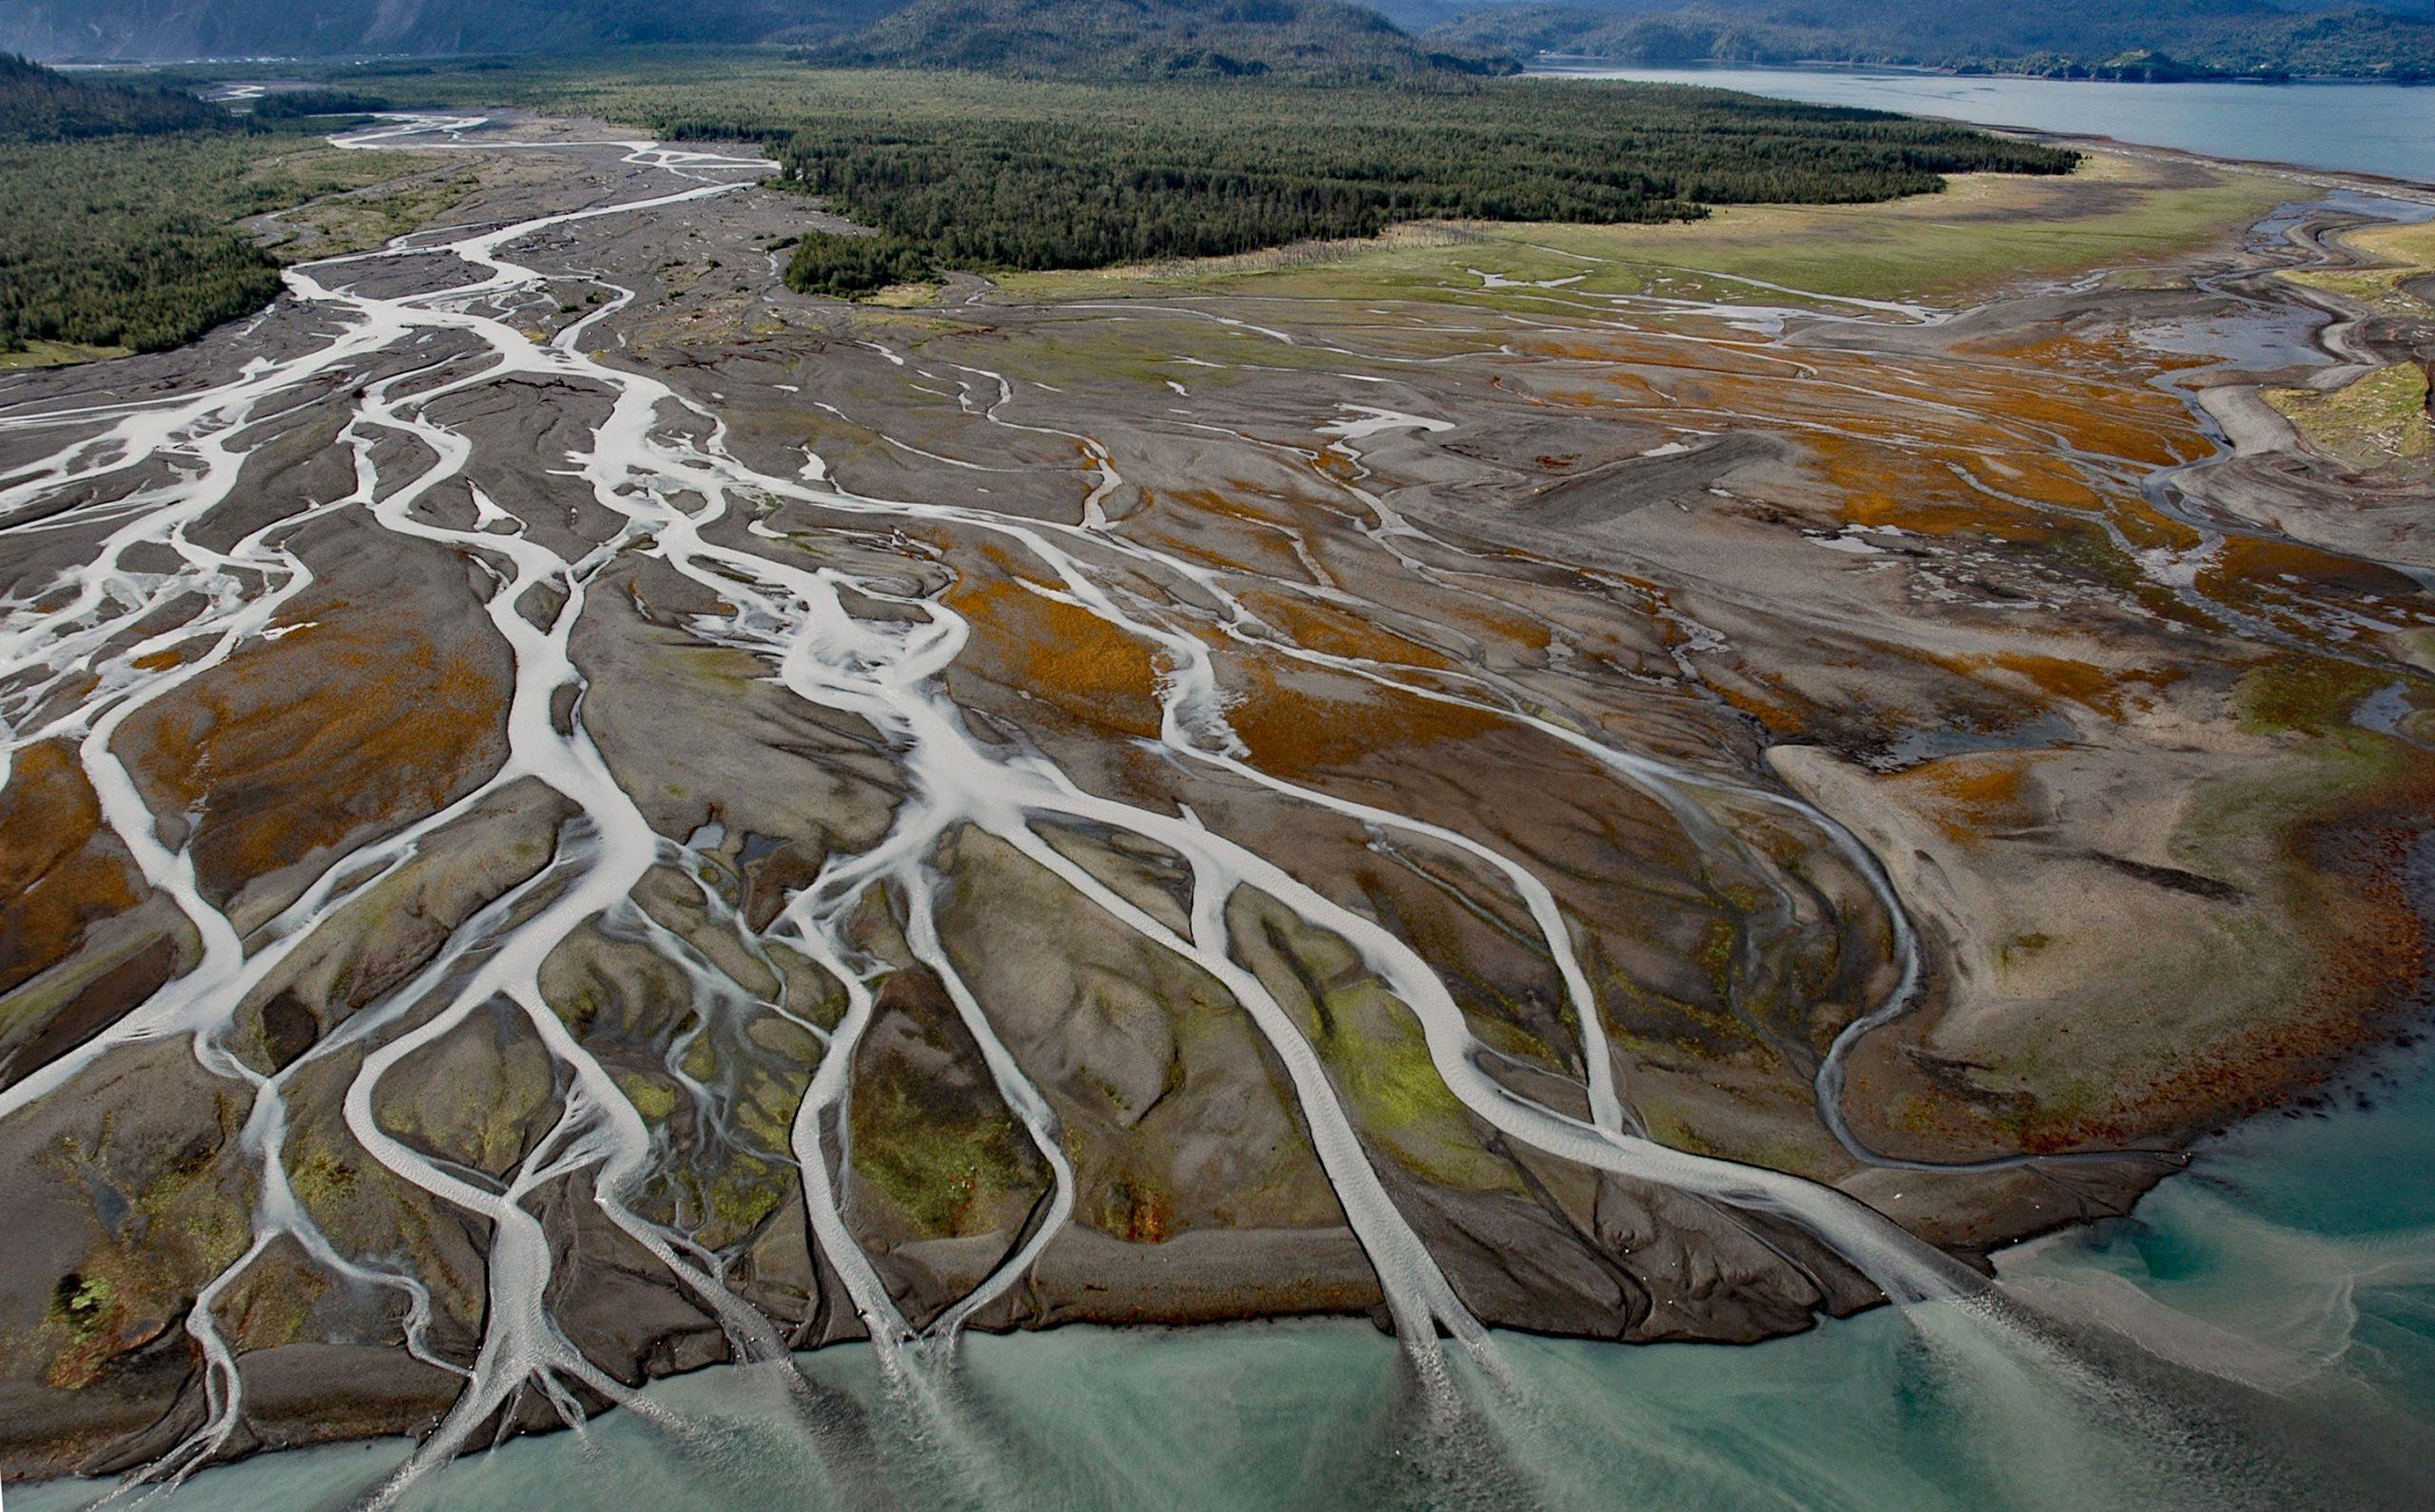
Grewingk Creek drains a glaciated watershed of 29,138 acres (11,792 ha) and flows generally northwest for 3.5 miles (5.6 km) from the terminus lake of the retreating Grewingk Glacier to the southeastern shore of Kachemak Bay, about 24 miles (39 km) northeast of Seldovia and 13 miles (21 km) east of Homer, Alaska. Grewingk Glacier trends northwest for about 12 miles (19 km) from an icefield to its terminus lake on the southern Kenai Peninsula. The glacier and creek were named in 1880 by William H. Dall, of the U.S. Coast and Geodetic Survey for Constantin Grewingk who in 1850, published papers in German on the geology and volcanism of Alaska.
Retreating glaciers generally produce high river discharges, large volumes of sediment, and steep channel slopes. River channels emanating from these glaciers respond to the discharge processes by developing a braided pattern with multiple channels separated by bars or islands. A braided river is one that, over some part of its length, flows in multiple, mobile channels across a gravel floodplain. Braided channel systems are high energy and variable so channel configurations are constantly changing. Three factors are probably necessary for braiding to occur: 1) an abundant sediment supply; 2) erodible banks; and 3) high-energy stream velocity.
When glacial rivers reach the sea the resulting beach sediments can also be highly dynamic with erosion events caused by storm-driven waves and deposition events caused by glacier surges and retreats. In Kachemak Bay, during periods of relative sediment stability, animals such as barnacles and mussels, and algae such as rockweed and sea lettuce, colonize the beach face creating multi-colored patterns. Since the slope angle is low, the intertidal zonation is stretched into wide bands, with each band representing the algae and invertebrates that can tolerate different levels of exposure to the air and sun with the twice-daily fluctuations of the tides. Read more here and here. Explore more of Grewingk Creek and Kachemak Bay here:

