
Climate Change
Recent Articles
More Articles
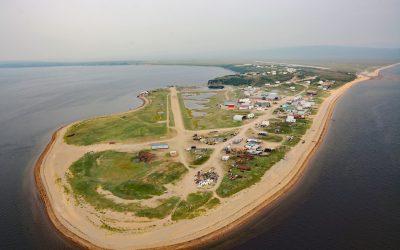
Golovin, Norton Sound
Golovin is a community on the northern shore of Norton Sound in the Bering Sea and situated on a sand spit between Golovnin Lagoon to the north and Golovnin Bay to the south, about 71 miles (114 km) east of Nome and 24 miles (38 km) west-southwest of Elim, Alaska.
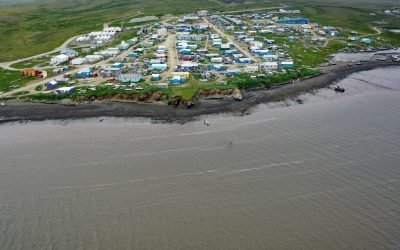
Toksook Bay, Nelson Island
Toksook Bay is a Yup’ik community on Nelson Island, in the Yukon-Kuskokwim Delta, about 112 miles (181 km) west-southwest of Bethel and 13.5 miles (22 km) west-northwest of Nightmute, Alaska.

Harriman Glacier, Prince William Sound
Harriman Glacier is 8 miles (13 km) long, and trends northeast to its terminus at the head of Harriman Fjord, in Prince William Sound, about 74 miles (119 km) west-southwest of Valdez and 16 miles (26 km) northeast of Whittier, Alaska.

Anchor Glacier, Northwestern Fjord
Anchor Glacier flows east for 3 miles (5 km) to Northwestern Fjord, which is located approximately 52 miles (84 km) east-northeast of Homer and 32 miles (52 km) southwest of Seward, Alaska.

Blackstone Glacier, Blackstone Bay
Blackstone Glacier flows north for 7 miles (11 km), terminating at tidewater at the head of Blackstone Bay, about 87 miles (140 km) west-southwest of Valdez and 8 miles (13 km) south of Whittier, Alaska.

Cataract Glacier, Surprise Inlet
Cataract Glacier flows to the southern shore of Surprise Inlet, a fjord in Prince William Sound, about 51 miles (82 km) east-southeast of Anchorage and 20 miles (32 km) northeast of Whittier, Alaska.
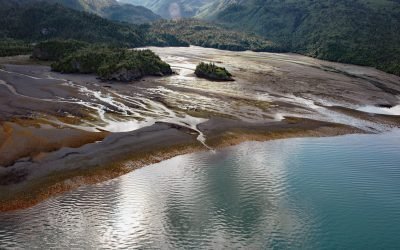
Mallard Bay, Portlock River
Mallard Bay is on the southern shore of Kachemak Bay on the Kenai Peninsula and adjacent to the mouth of the Portlock River, approximately 14 miles (23 km) east-northeast of Homer and 4 miles (6 km) south-southwest of Bear Cove, Alaska.
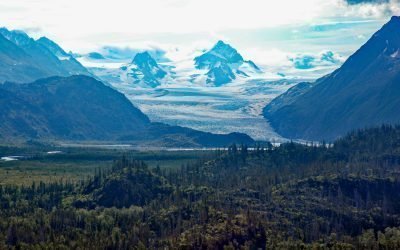
Grewingk Glacier, Kachemak Bay
Grewingk Glacier starts in the Kenai Mountains and flows generally northwest for 11 miles (18 km) to a proglacial lake about 2 miles (3.2 km) long that is drained by Grewingk Creek that flows 3.5 miles (6 km) to the southern shore of Kachemak Bay, about 25 miles (40 km) northeast of Seldovia and 16 miles (25 km) east-southeast of Homer, Alaska.
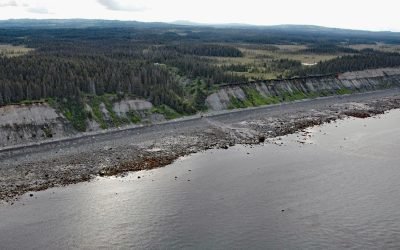
Travers Creek, Kachemak Bay
Travers Creek flows generally west-southwest to the north shore of Kachemak Bay, approximately 3.5 miles (5.5 km) south of Anchor Point and 12 miles (19 km) northwest of Homer, Alaska.
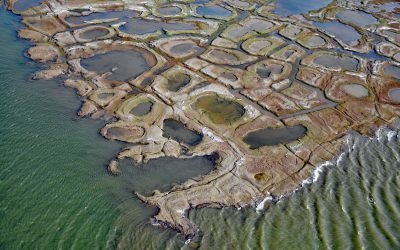
Fish Creek, Harrison Bay
Fish Creek flows generally northeast for approximately 110 miles (177 km) to Harrison Bay at the western edge of the Colville River Delta, about 141 miles (230 km) southeast of Utqiaġvik and 12 miles (19 km) north-northwest of Nuiqsut, Alaska.
About the background graphic
This ‘warming stripe’ graphic is a visual representation of the change in global temperature from 1850 (top) to 2019 (bottom). Each stripe represents the average global temperature for one year. The average temperature from 1971-2000 is set as the boundary between blue and red. The colour scale goes from -0.7°C to +0.7°C. The data are from the UK Met Office HadCRUT4.6 dataset.
Click here for more information about the #warmingstripes.