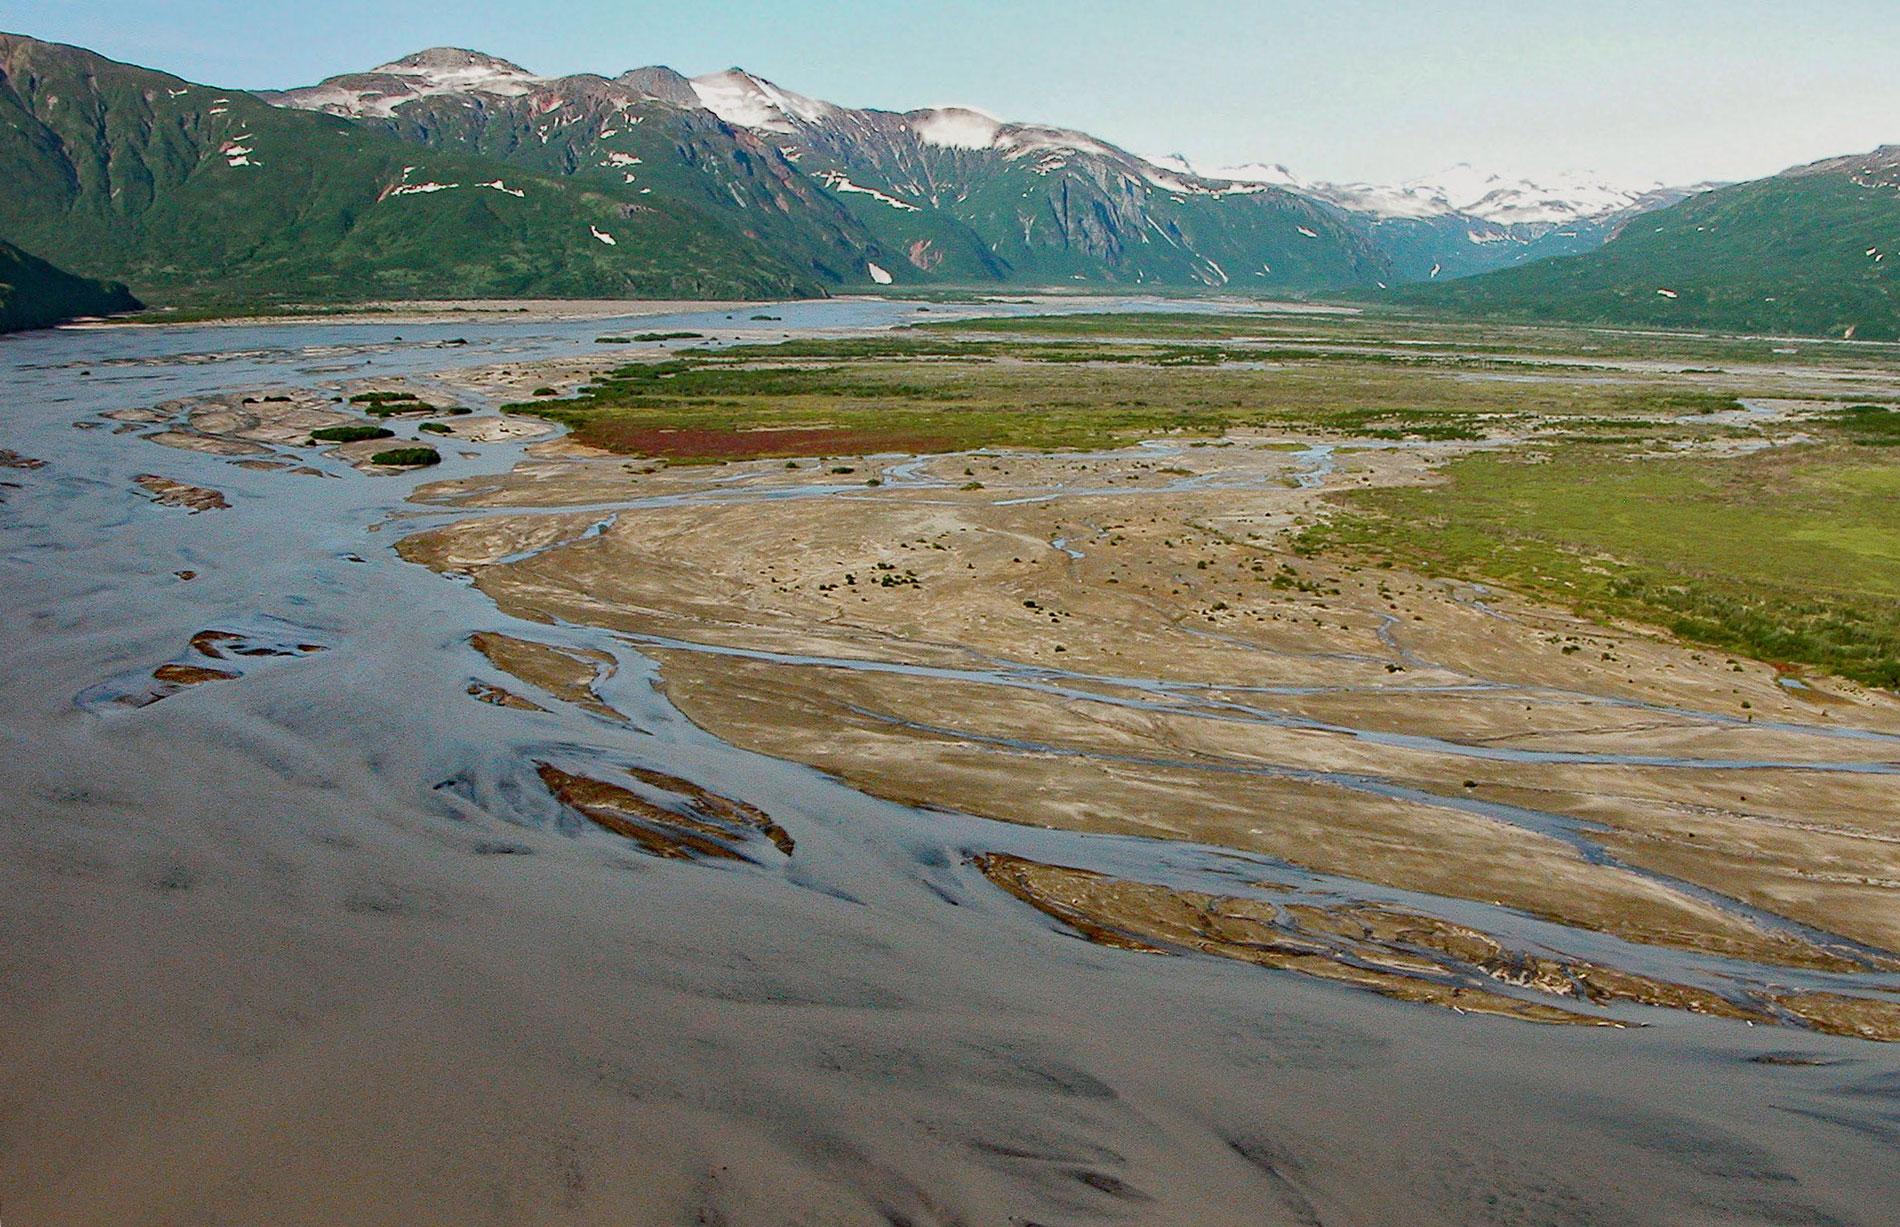
Aguchik River starts at the terminus of Aguchik Glacier at an elevation of about 1,060 feet (323 m) and flows generally southeast for 8 miles (13 km) to the head of Kukak Bay in Katmai National Park and Preserve, about 138 miles (222 km) southwest of Homer and 80 miles (129 km) northwest of Kodiak, Alaska. Aguchik Glacier starts on the southeastern flank of Snowy Mountain that has a summit elevation of 7,090 feet (2,161 m) and flows generally southeast for 7.5 miles (12 km). The name is from Aguchik Island, which is situated in Kukak Bay near the river mouth, and is an Aleut name published in 1847 as ‘Ostrov Aguchik’ on Russian hydrographic charts. Kukak Bay is an estuary that extends southwest 10 miles (16 km) into the Alaska Peninsula from Kukak Point, on the western coast of Shelikof Strait. Kukak is an Aleut name recorded by early Russian explorers as ‘Guba Kukak’. The bay was first explored and charted in 1831 by Ensign Mikhail Vasilyev of the Imperial Russian Navy who surveyed and mapped the Alaska Peninsula from Cook Inlet south and west nearly to Chignik Bay. These maps were published by Captain Friedrich Benjamin von Lütke in his ‘Voyage Around the World’ in 1836.
Snowy Mountain was first described in 1916 by Robert F. Griggs, of the National Geographic Society as ‘Princess Peak’, and in 1919, as ‘Snowy Mountain’ because of the extensive glaciers nearby. Griggs was a botanist who led an expedition in 1915 to observe the aftermath of the Katmai volcanic eruption. In 1918, his advocacy for protecting the area resulted in President Woodrow Wilson declaring 1,088,000 acres (440,298 ha) of land as Katmai National Monument. Snowy Mountain is a small andesite-dacite volcano that started developing about 200,000 years ago in the Aleutian Range about 11 miles (18 km) northeast of Mount Katmai that famously erupted in 1912. Eruptions have taken place from two vents about 2.5 miles (4 km) apart, though only the northeastern vent has been active in the Holocene. The rocks immediately surrounding Kukak Bay are mostly lava flows, sills, and pyroclastic tuff. The lava flows are composed of dark-reddish-brown andesite and dacite. Intruding these rocks are several granitic plutons of Tertiary age, into which the glaciers have incised canyons that are filled with unconsolidated and poorly consolidated surficial deposits, mainly gravel, sand, and silt.
Aguchik River forms a braided outwash plain at the head of Kukak Bay. The plain is formed by the deposition of sediments transported by meltwater from the glacier terminus. Larger boulders and cobbles are typically deposited near the terminal moraine and smaller particles travel farther before being deposited. The high sediment load of the river results in a massive volume of sediments being deposited creating a network of multiple shallow channels that diverge and rejoin around braid bars. The braid bars are unstable accreting islands separated by constantly shifting channels. In addition to glacial sediments, coarse ash and pumice, principally from volcanic activity in 1912, covers much of the depositional terrain along the Shelikof Strait coast. This highly dynamic environment precludes the river from being suitable for salmon spawning; although, pink and chum salmon have been observed in the river. Read more here and here. Explore more of Aguchik River and Kukak Bay here:

