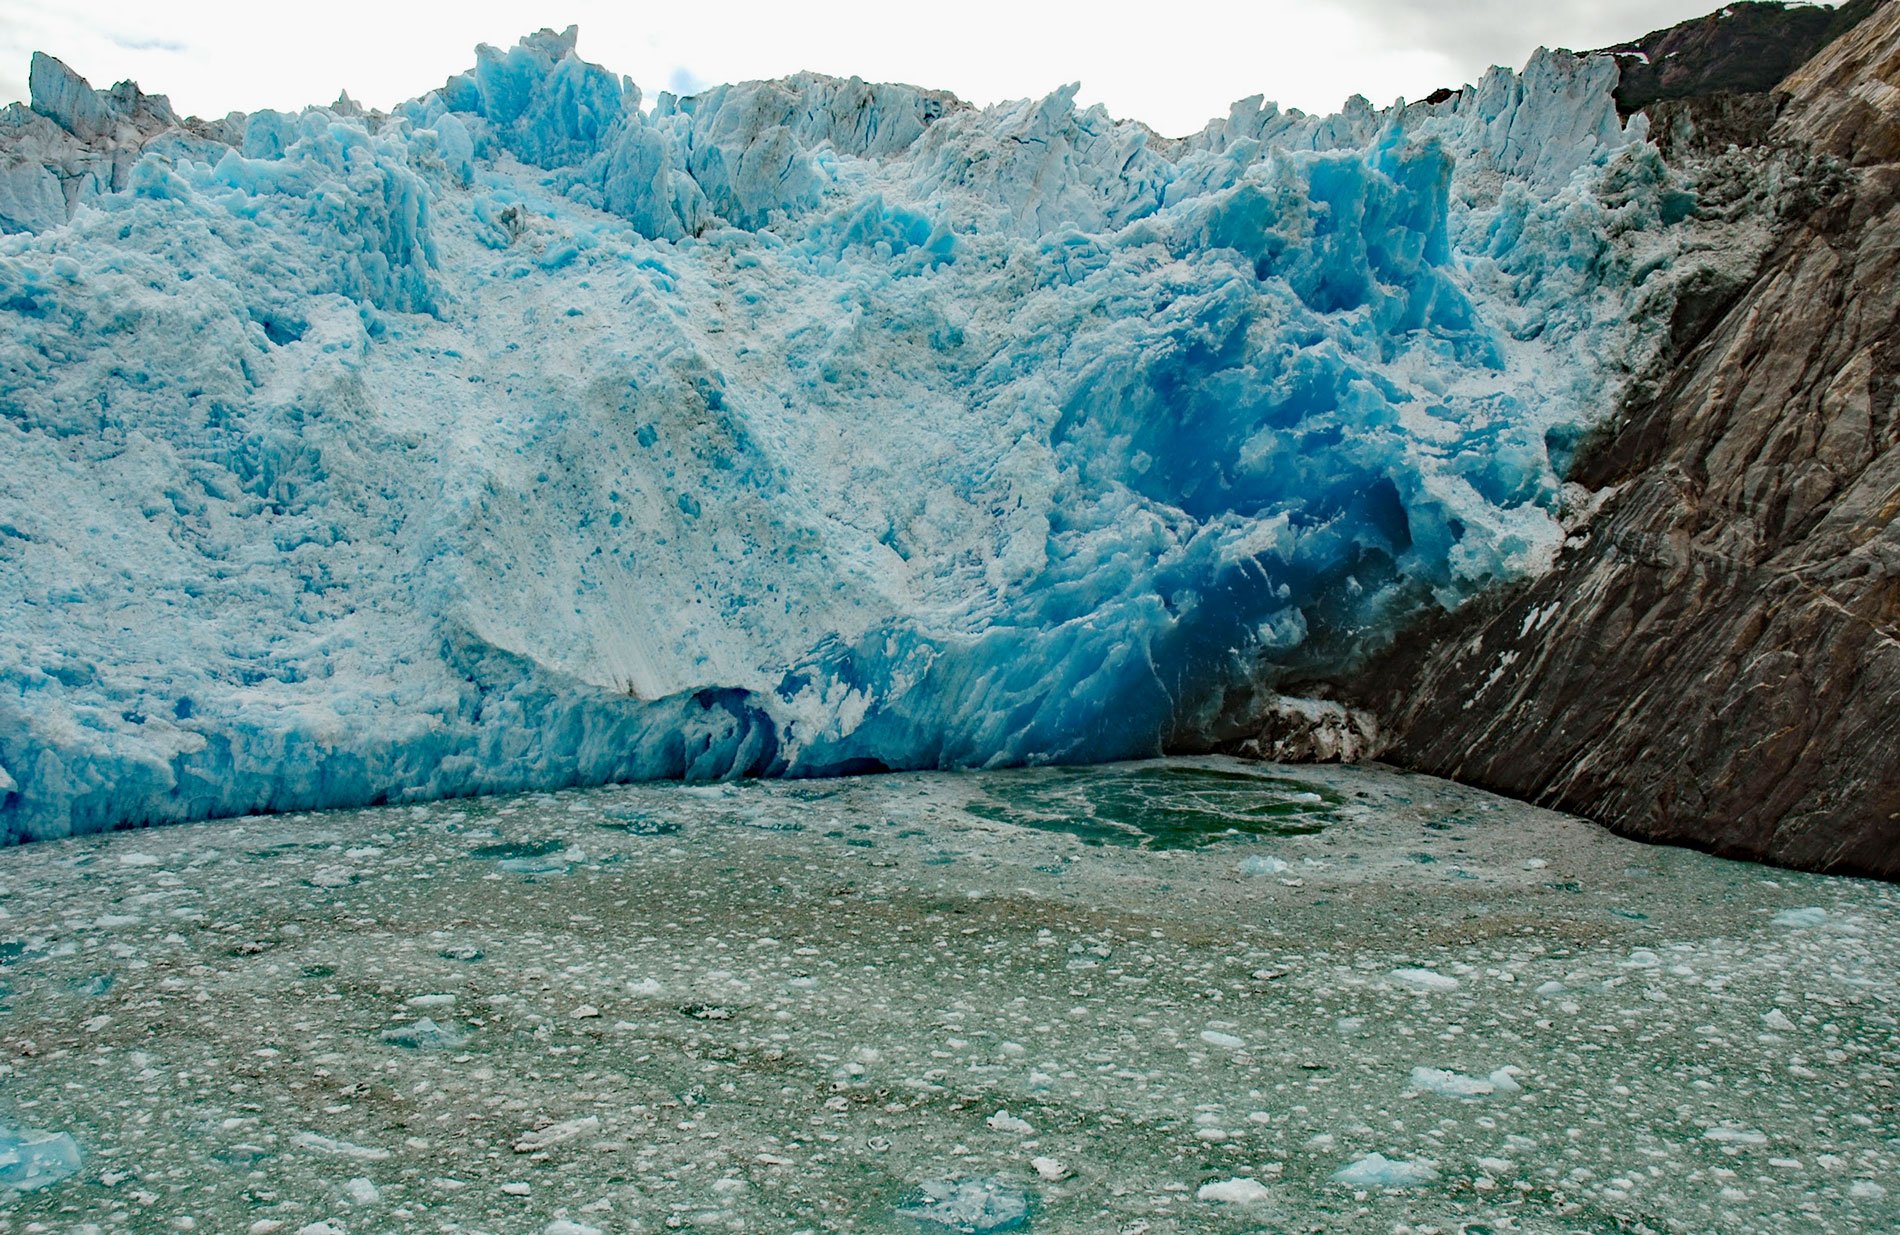
South Sawyer Glacier starts in British Columbia and flows northwest for 31 miles (50 km) to the head of Tracy Arm, about 73 miles (118 km) north of Petersburg and 56 miles (90 km) southeast of Juneau, Alaska. The glacier was named in 1889 by Commander H.B. Mansfield of the U.S. Navy. Tracy Arm is a fjord that trends northwest from the glacier terminus for 18 miles (29 km) and then southwest for 10 miles (16 km) to Holkham Bay. The fjord is surrounded by steep mountains and fed by Sawyer and South Sawyer Glaciers and their tributary glaciers. The fjord was named in 1889 for B.F. Tracy who was the Secretary of the Navy under President Benjamin Harrison at the time, and served during the Civil War in the Union forces as a Brigadier General.
The water depth at the terminus of South Sawyer Glacier in the 1980s was 590-650 feet (180-200 m) and the velocity of the calving front was about 1 mile/year (1.8 km/yr). The glacier retreated 2 miles (3.5 km) from 1899-1967 and then experienced little retreat from 1967 to 1985. From 1985 to 2016, the glacier terminus has retreated 1.4 miles (2.3 km), mostly between 1996 and 2016. This retreat was driven by rising snowlines in the region that has also driven the retreat of North Dawes, Baird, Dawes, and Sawyer Glacier.
In 2016, the velocity of the calving front had decreased to less than 2900 feet/year (900 m/yr) and the water depth at the terminus was 360 feet (110 m). Just south of the glacier terminus, a smaller tributary glacier that in 1985 was the combination of two glaciers had separated, and the western arm had retreated 2.8 miles (4.5 km) and the eastern arm had retreated 2.4 miles (3.8 km). Most importantly, South Sawyer Glacier now appears to be near the tidewater limit of Tracy Arm. Read more here and here. Explore more of South Sawyer Glacier here:

