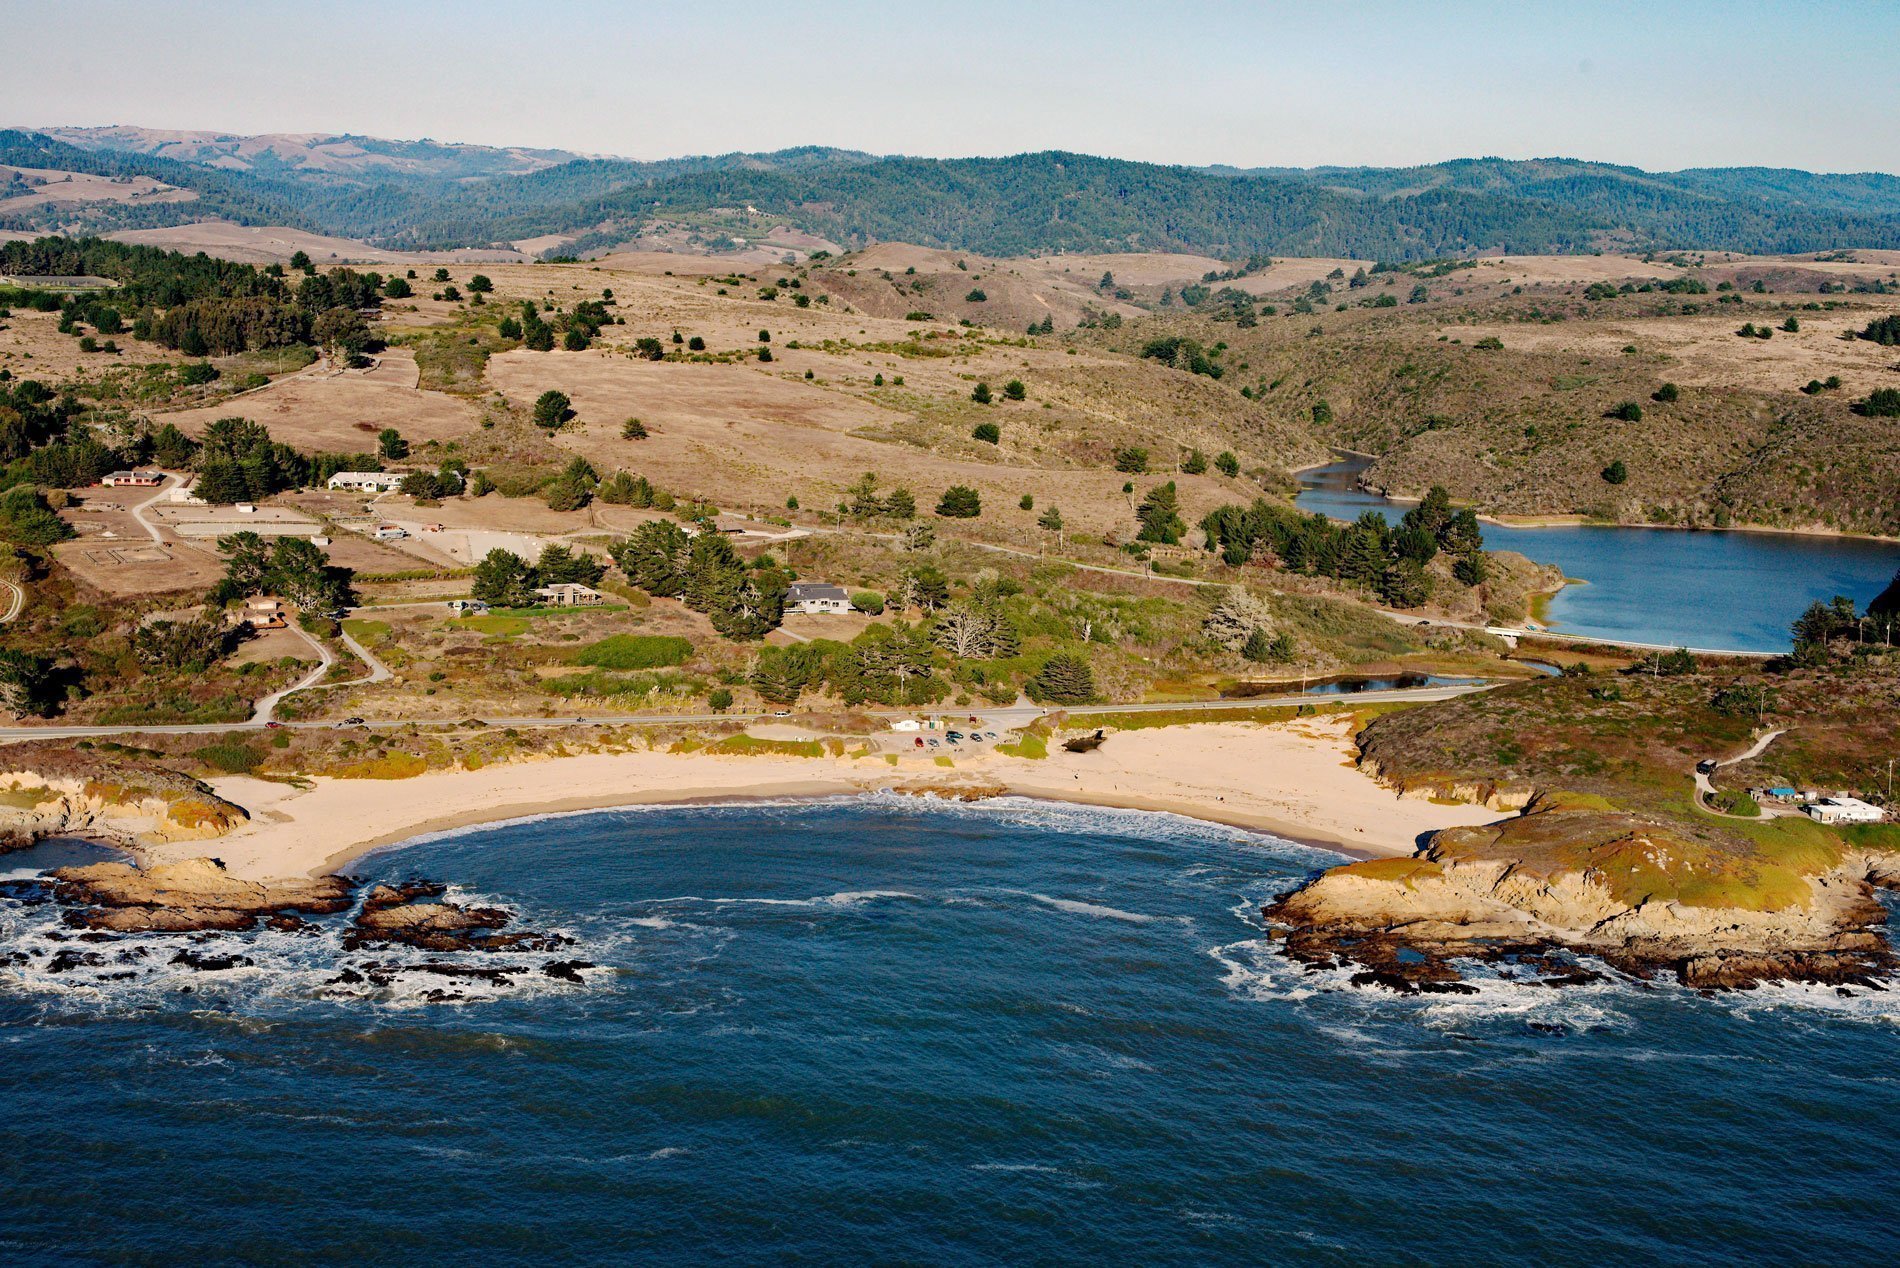
Arroyo de Los Frijoles Beach and Pebble Beach are in Bean Hollow State Park, located 17.5 miles (28.2 km) south of Half Moon Bay and 3 miles (4.8 km) south of Pescadero, California. The name Bean Hollow is from the translation of Cañada Del Frijol which was applied in the 1840s. The English term was in use by 1861.
Arroyo de Los Frijoles Beach is the southern beach in Bean Hollow State Beach. The cove has a sandy beach with some rocks near the center and two rocky points partially enclosing the cove from the ocean. This shape of the cove creates a strong current so swimming is dangerous here. The creek flowing through Arroyo de Los Frijoles flows from Reservoir de Los Frijoles to Lake Lucerne Reservoir next to Highway 1 and then seeps through the beach south of the parking area.
Pebble Beach is the northern beach in the park. This is a small cove with a pebbly coarse brown beach sand. In 1867, a local newspaper reported that pebbles were being taken as souvenirs for display in jars on the mantels of upper-class homes. The beach became popular for collectors of wave polished multicolored agates, opals, jaspers, and carnelians found in great abundance. All that activity came to an end when Loren Coburn, the wealthy landowner, closed the road gate in 1891 which subsequently launched a court battle over public access and property rights in California. In 1893, the beach was dedicated as a county park, but unfortunately, the park designation failed to ensure that the road was public land. In July 1896, a judge decided that the beach was state property and so was the pebbles, but the beach access road was private. In 1958, the 44-acre (18 ha) park property was acquired by the state, and today, there is public access to the beach but pebble collecting is not allowed. Read more here and here. Explore more of Arroyo de Los Frijoles Beach here:

