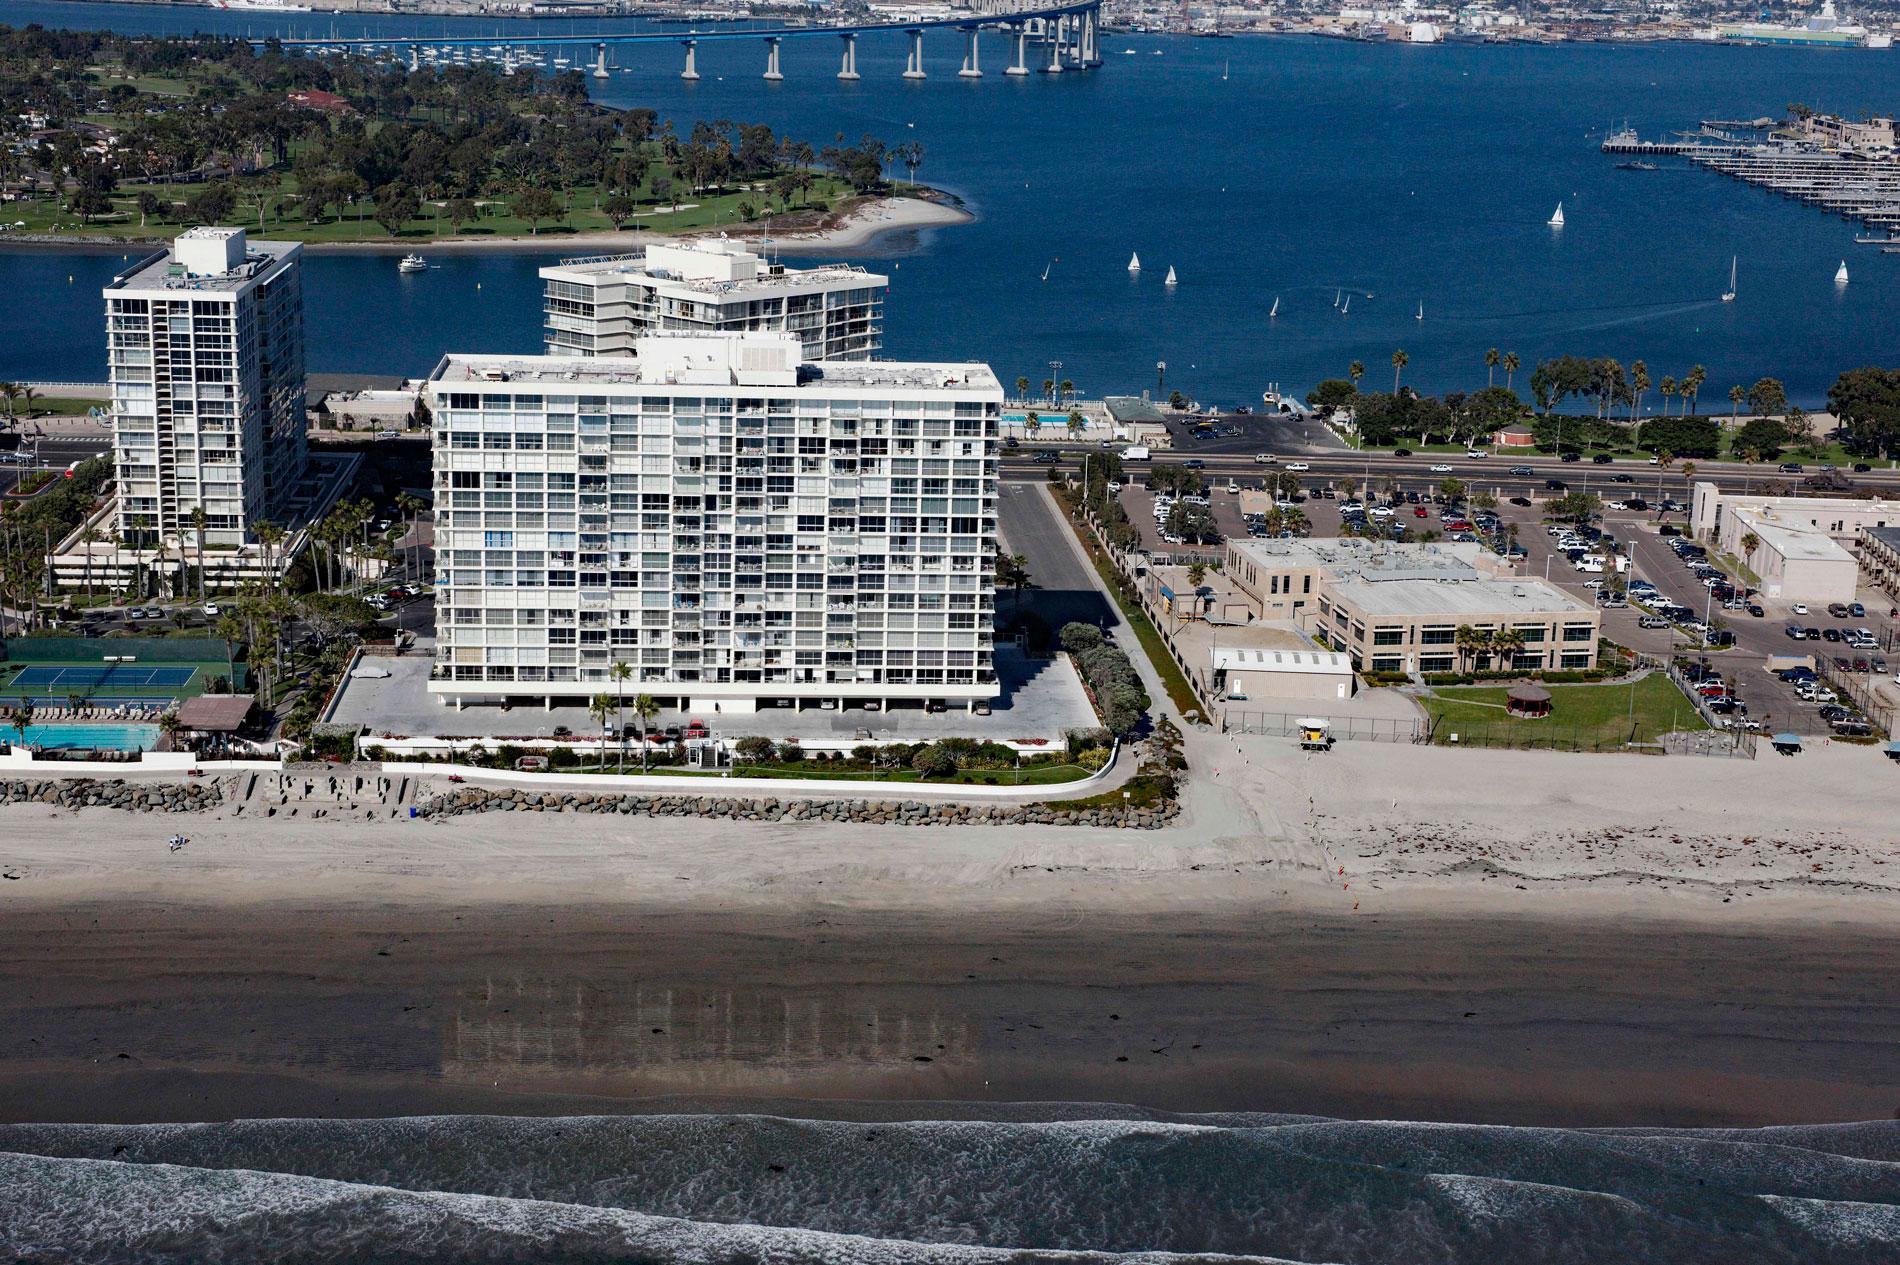
The shipwreck of the SS Monte Carlo is occasionally exposed by shifting sands during the winter on Coronado Shores, a wide sandy beach also known as South Beach, on Coronado Island about 4.5 miles (7.3 km) east of Point Loma and 3.4 miles (5.5 km) south of San Diego, California. The concrete ship was 300 feet (91.5 m) long and launched in 1921 as an oil tanker. In 1937, the ship was used as a floating casino and was blown onto South Beach during a storm on New Year’s Day.
During World War I the construction of concrete ships was approved to reduce the use of steel. In total, 24 ships were contracted by the Emergency Fleet Corporation but only 12 ships were completed by the 1918 armistice. Tanker No. 1 was already under construction by the Liberty Ship Building Company in Wilmington, North Carolina, and was launched in 1921 for use by the U.S. Quartermaster Corps. In 1923, the vessel was purchased by the Associated Oil Company of San Francisco and re-purposed as the commercial oil tanker McKittrick. In 1932, McKittrick was sold and renamed Monte Carlo, and converted for the purpose of gambling, prostitution, and drinking, all of which was illegal during Prohibition. In 1932, Monte Carlo opened for business off Long Beach, California taking advantage of the crowds gathered for the first Los Angeles Olympics.
In 1936, Monte Carlo was moved to international waters off Coronado Island where law enforcement was unable to regulate the ship’s operations. In 1937, Monte Carlo was anchored 3 miles (4.8 km) offshore during a storm on New Year’s Day when the anchor lost its hold. The ship drifted onto the beach in front of what is now the El Camino Tower of the Coronado Shores condominiums. The wreckage can be seen underwater at low tide and is occasionally exposed during strong storm tides. Read more here and here. Explore more of Coronado Shores here:

