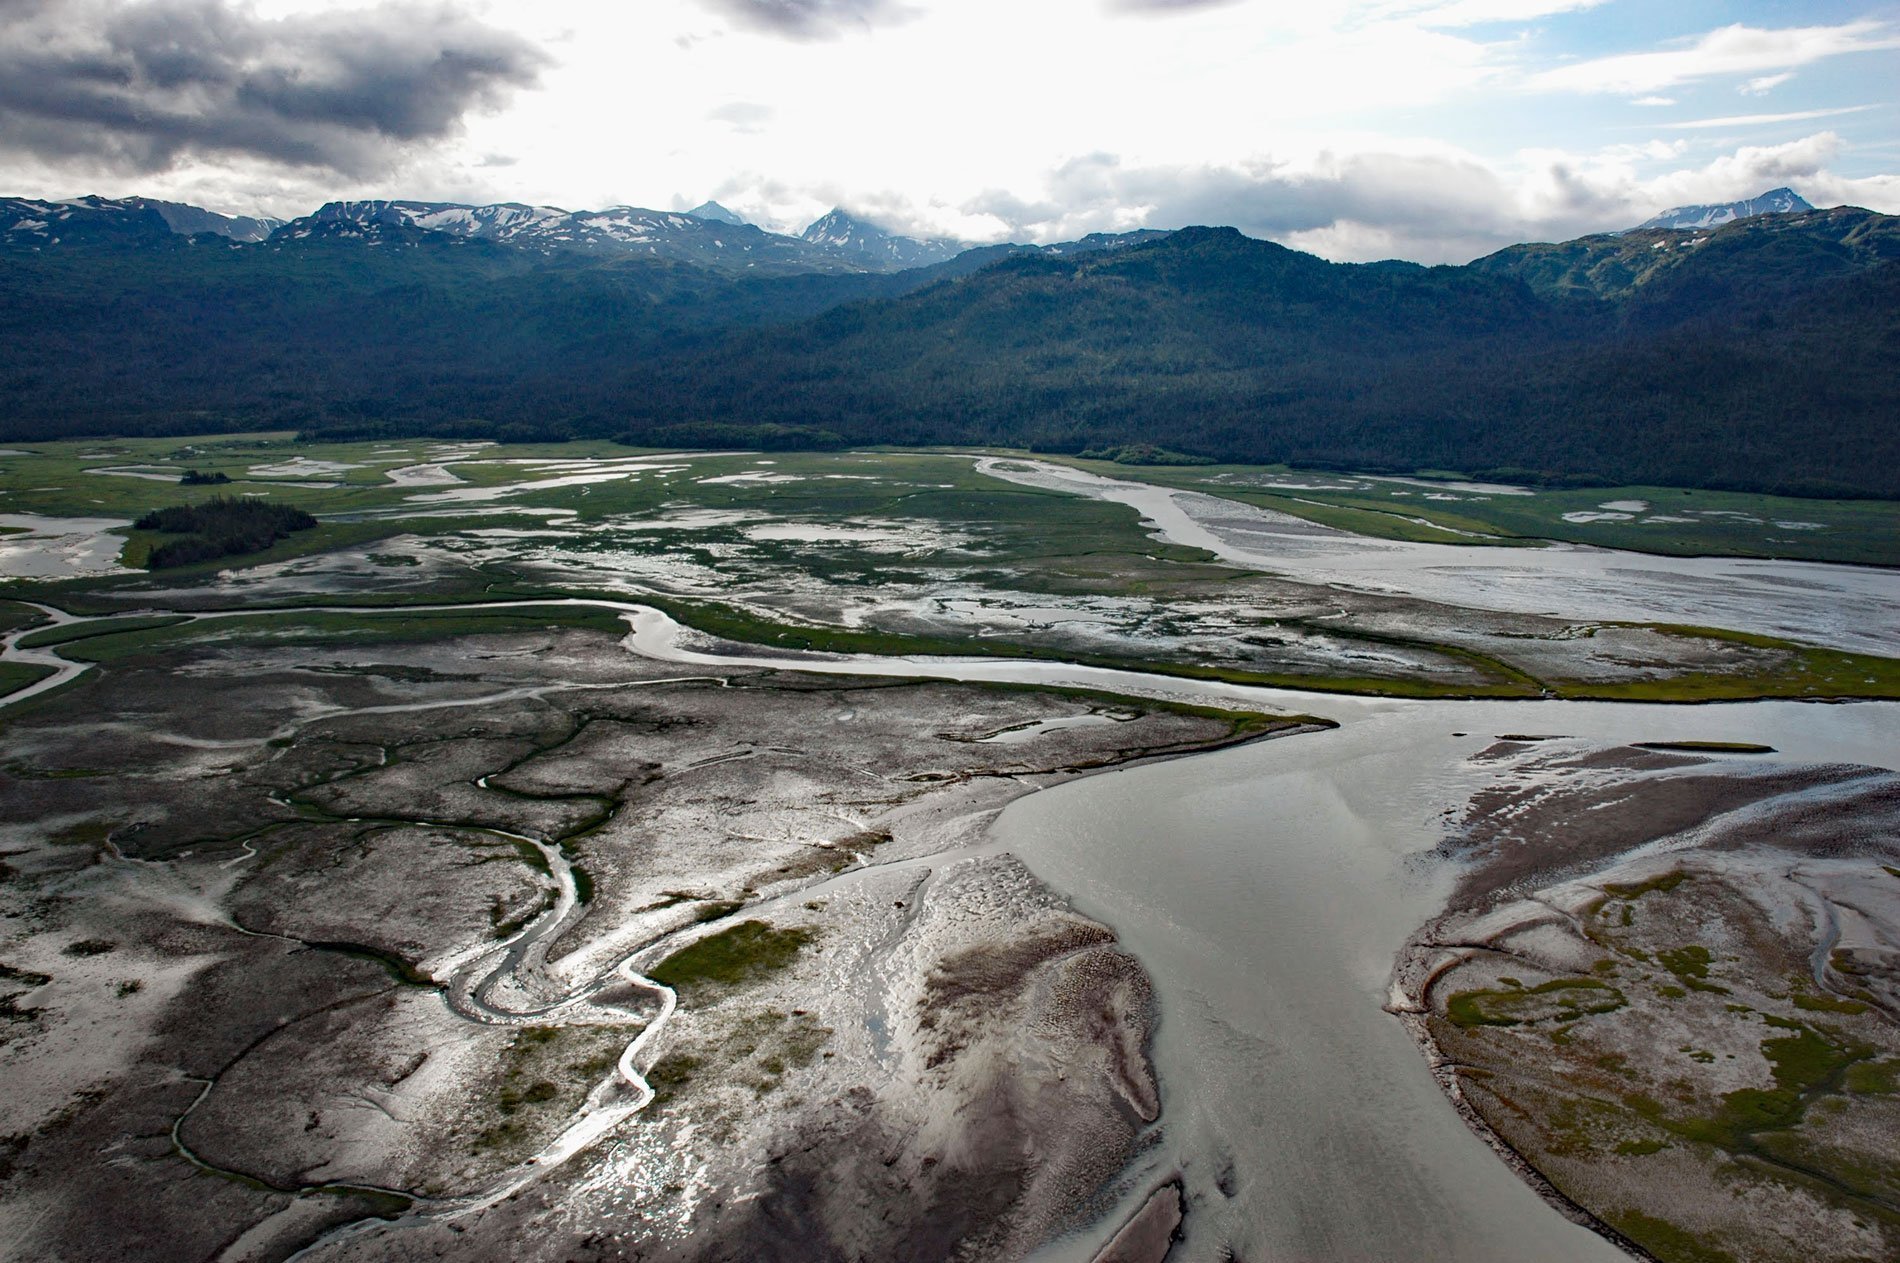
Bradley River is located on the Kenai Peninsula and flows generally northwest for 7 miles (11 km) from Bradley Lake at an elevation of 1,090 feet (332 m) to Kachemak Bay, about 31 miles (50 km) southeast of Ninilchik and 25 miles (40 km) northeast of Homer, Alaska. The river is reputedly named after John A. Bradley, a local prospector, and the name was first published by the U.S. Geological Survey in 1951. The lake is formed by meltwater discharge from the Kachemak Glacier and Nuka Glacier. The Kachemak Glacier starts at an elevation of 4,400 feet (1,341 m) and descends about 4 miles (6.5 km) from the Harding Icefield to an elevation of 2,200 feet (670 m). From 1950 to 2015, this glacier retreated about 1 mile (1.6 km). The Nuka Glacier starts at about 4,600 feet (1,400 m) in the Grewingk-Yalik Glacier Complex and descends about 4 miles (6.5 km) to an elevation of 1,600 feet (488 m).
The Bradley Lake hydroelectric project consists of a concrete-faced, rock-filled dam 125 feet (38 m) high, several diversion structures, and a power tunnel 3.5 miles (5.6 km) long, with a diameter of 11 feet (3.4 m), which transports water from the dam to the powerhouse near the mouth of the Martin River at the head of Kachemak Bay. The power generation potential of Bradley Lake was first studied by the U.S. Army Corps of Engineers in 1955. The Alaska Power Authority assumed responsibility for the project in 1982 and it was completed in 1991. It now provides relatively inexpensive power to Kachemak Bay communities.
The terminus of Nuka Glacier is at Bradley Pass, which is the watershed divide between the Nuka River that flows east into Kenai Fjords National Park, and the Bradley River that flows west into Kachemak Bay. Prior to 1991, most of Nuka Glacier outflow went into the Nuka River during low-flow periods, but during high discharges, most of the water went into the Bradley River. In order to maximize the flow going into Bradley River, a dike 5 feet (1.5 m) high was built at Bradley Pass to divert all of the river into Bradley Lake. In 2020, a diversion project of Battle Creek was completed that increased the hydropower output by about 10 percent. The retreat of the Dixon Glacier has created a meltwater stream that could be diverted into the Bradley Lake reservoir and potentially increase the hydropower output by about 50 percent. Read more here and here. Explore more of Bradley River here:

