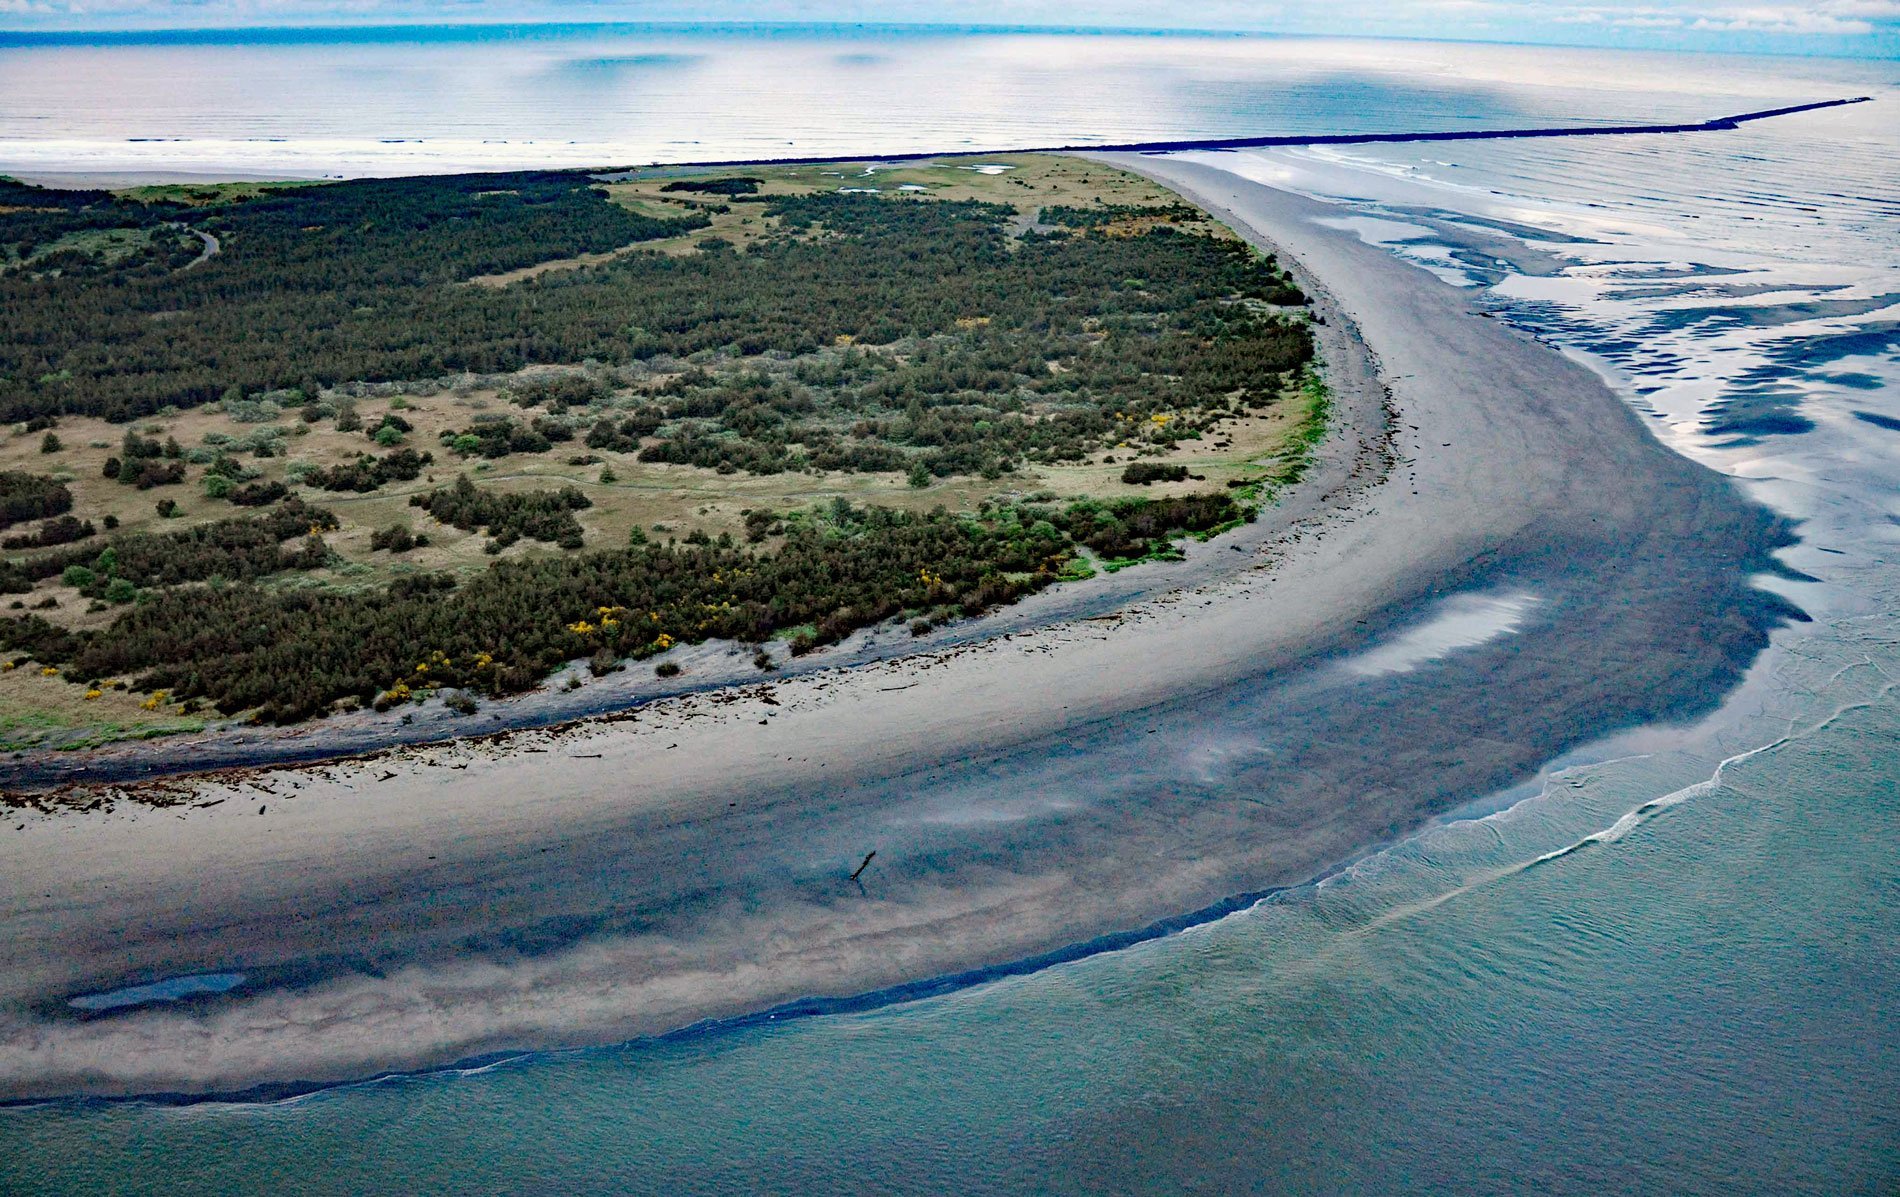
Clatsop Spit is part of Fort Stevens State Park that projects north from the south bank of the Columbia River and the submerged portion forms the Columbia River Bar, about 80 miles (129 km) northwest of Portland and 9 miles (15 km) west-northwest of Astoria, Oregon. The spit was formed by sediments brought to the coast by the Columbia River after the last ice age ended, approximately 8,500 years ago. The name Clatsop Spit usually refers to the northern end of the spit, or the area that is bounded by the Pacific to the west and the Columbia River to the north. In the past, the spit was known as Clatsop Sands.
The Columbia River Bar is a system of shoals at the mouth of the Columbia River spanning between the states of Oregon to the south and Washington to the north. The bar is about 3 miles (5 km) wide and 6 miles (10 km) long and is now prevented from fully developing by jetties on the north and south sides of the river entrance and by active dredging to maintain a shipping channel. Since 1792, over 2,000 large ships, such as Peter Iredale, have sunk in this area which is part of the Graveyard of the Pacific. The nearby U.S. Coast Guard Station Cape Disappointment is renowned for operating in some of the roughest sea conditions in the world and is home to the National Motor Lifeboat School.
Despite the hazardous conditions caused by the velocity of the outgoing current and the often opposing onshore winds and waves, the Columbia River Bar Marine Pilots routinely navigate ships across the bar. Approximately 16 bar pilots guide ships across the bar and upstream to ports along the Columbia River. They generally consider “the bar” to be the area between the north and south jetties and Sand Island in Baker Bay to the east. The bar pilots often board ships from a pilot boat or by helicopter. Read more here and here. See a short video here. Explore more of Clatsop Spit and the Columbia River Bar here:

