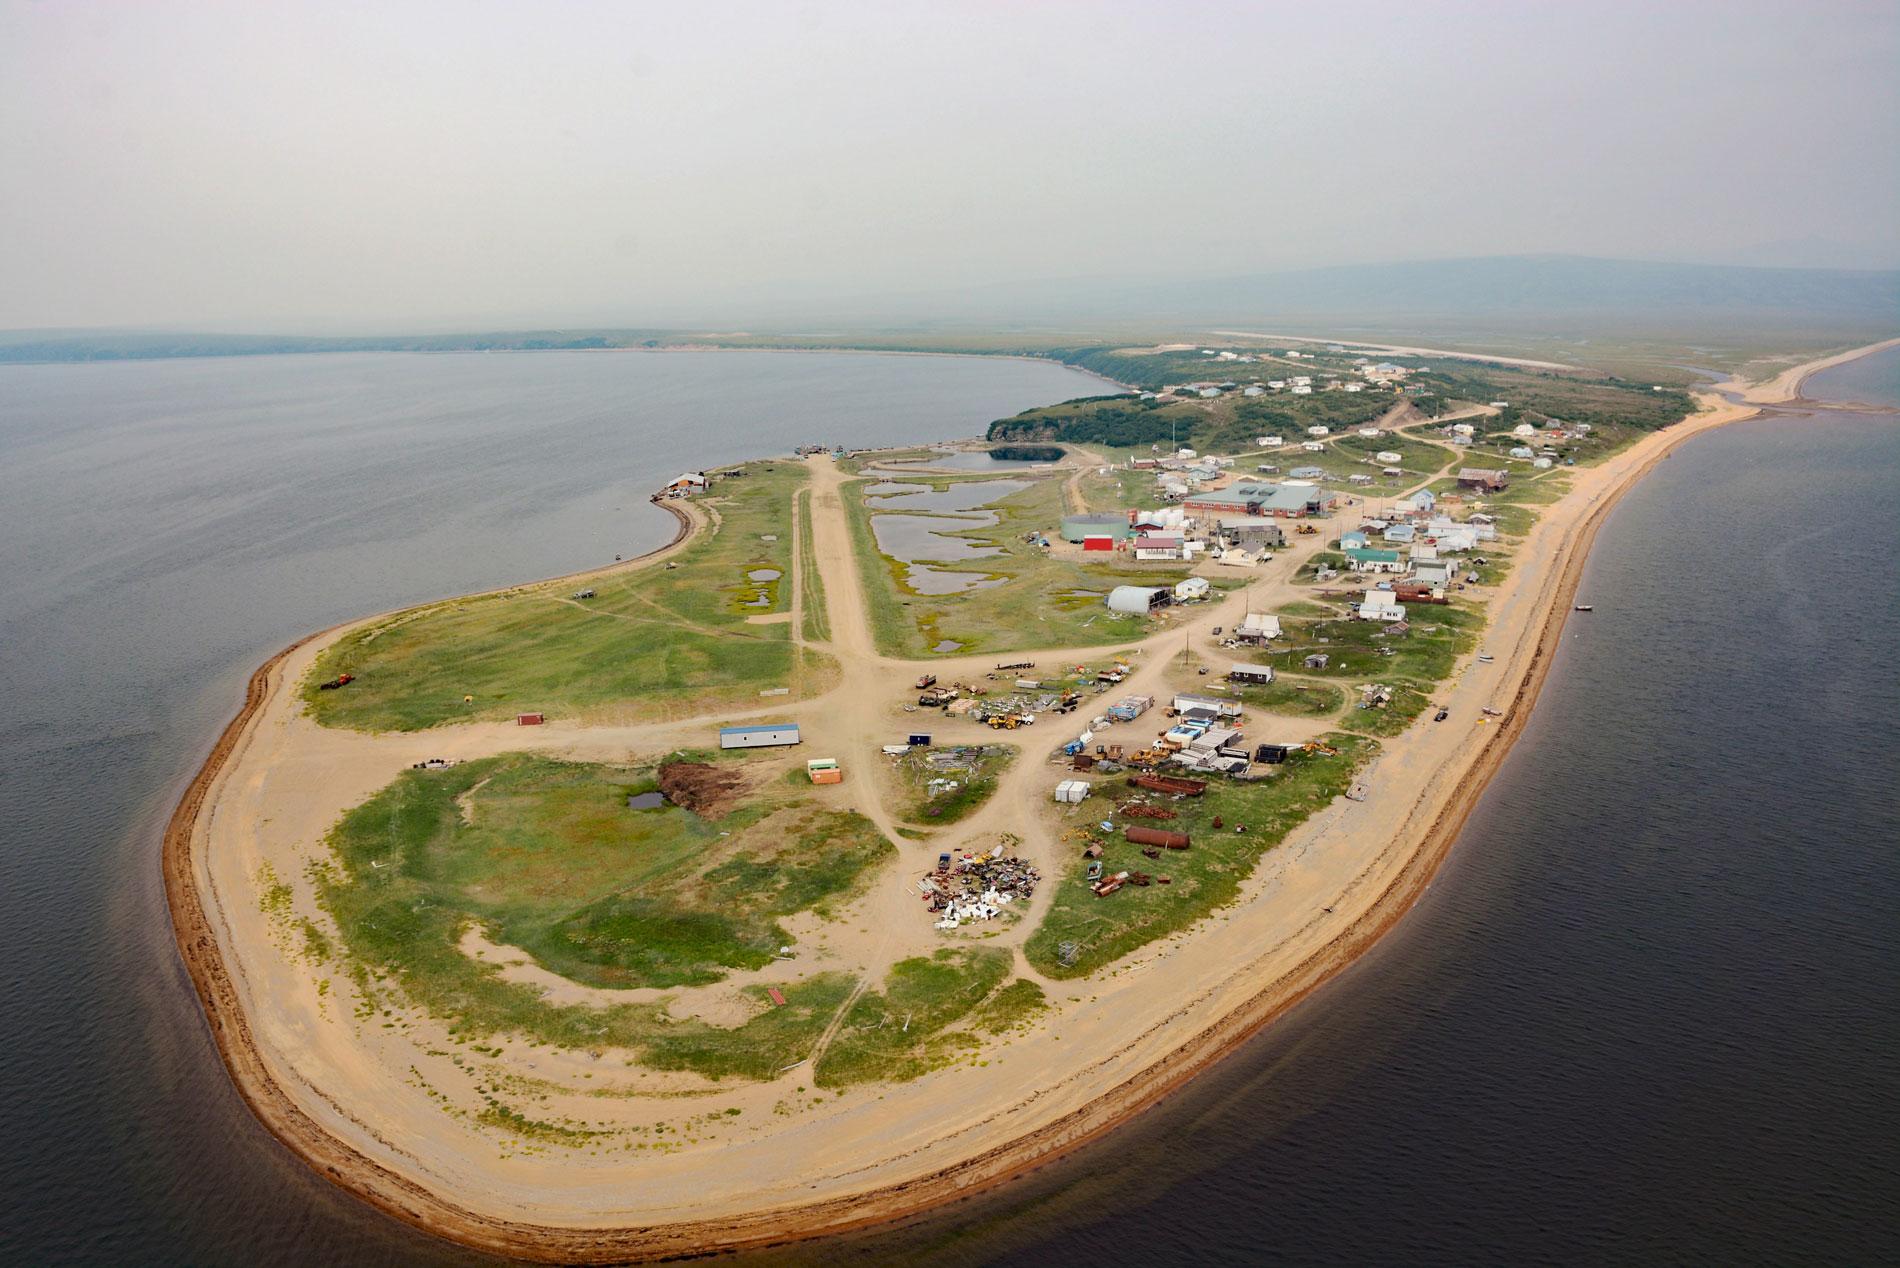
Golovin is a community on the northern shore of Norton Sound in the Bering Sea and situated on a sand spit between Golovnin Lagoon to the north and Golovnin Bay to the south, about 71 miles (114 km) east of Nome and 24 miles (38 km) west-southwest of Elim, Alaska. Golovin was originally an Iñupiat village called Cheenik, and the present name was derived from Golovnin, the name given by early Russian traders after Vice-Admiral Vasily M. Golovnin. The community is near the mouth of Cheenik Creek and mostly well below an elevation of 33 feet (10 m), although several newer developments including an airport are at higher elevations. Cheenik Creek starts at an elevation of 850 feet (259 m) on the Seward Peninsula and flows generally southwest for 11 miles (18 km) draining a watershed of 18,064 acres (7,310 ha). The watershed is formed by rocks associated with the Nome Complex that was intruded by the Kachauik pluton and consist of granodiorite–quartz monzonite at higher elevations, gneissic monzonite on the west facing slopes, and Quaternary sediments at lower elevations.
From 1807 to 1809, Golovnin commanded the sloop Diana and made a voyage around the world to visit the Russian-American Company settlement at Sitka. In 1817, Golovnin commanded the frigate Kamchatka and was tasked with surveying the northwestern coast of Alaska. In 1842, Lieutenant Lavrenty Zagoskin was sent to Alaska to scout locations for trading posts and discovered the village and harbor at present day Golovin. In 1890, John Dexter, an employee of the Omilak Mine about 30 miles (48 km) north-northeast of Golovin Bay, married an Iñupiat woman and established a trading post at Cheenik. Dexter became the local authority for prospecting information on the Seward Peninsula. In 1893, the Mission Covenant of Sweden established a church and school in Cheenik, and later a mission about 8 miles (13 km) southeast of Cheenik at a reindeer station on the mainland near Carolyn Island. In 1898, Cheenik became a supply-relay point for the Council goldfields to the north. Supplies were unloaded from ships at Cheenik and shipped across Golovnin Lagoon and up the Fish River or Niukluk River to Council. Reindeer herding became an integral part of the missions in the 1900s; however, the mission in Golovnin Bay was abandoned in 1904 and moved to Elim after a series of severe storms. Today, Golovin is a blended Inupiat and Yup’ik village that maintains a subsistence lifestyle of fishing, hunting, and gathering. The village is an important checkpoint on the Iditarod Sled Dog Trail and about 65 miles (105 km) from the finish in Nome.
Northwestern Alaska coastal communities built near sea level are particularly vulnerable to flooding and erosion from storm surges caused by extratropical cyclones during fall storm seasons. Golovin, situated near sea level on a sand spit, has been identified as one of the coastal communities threatened by flooding and erosion. The residents of Golovin routinely use the spit beaches for travel and for subsistence hunting and fishing. The beach adjacent to the Cheenik River mouth has also been mined for road surface materials. The village is subject to episodic flooding with a return interval of 5 to 10 years, and the spit can experience a complete overwash at a 50-100-year return interval. Although sediments are transported during these events, the long-term effects appear to be minimal, suggesting that sediment transport is balanced under the existing conditions of waves, currents, and sea level and neither erosion nor accretion dominates the sediment dynamics. However, known effects of climate change such as rising sea level, increased frequency and magnitude of storms, and longer periods of wave exposure due to loss of sea ice could compromise the existing sediment balance. Read more here and here. Explore more of Golovin here:

