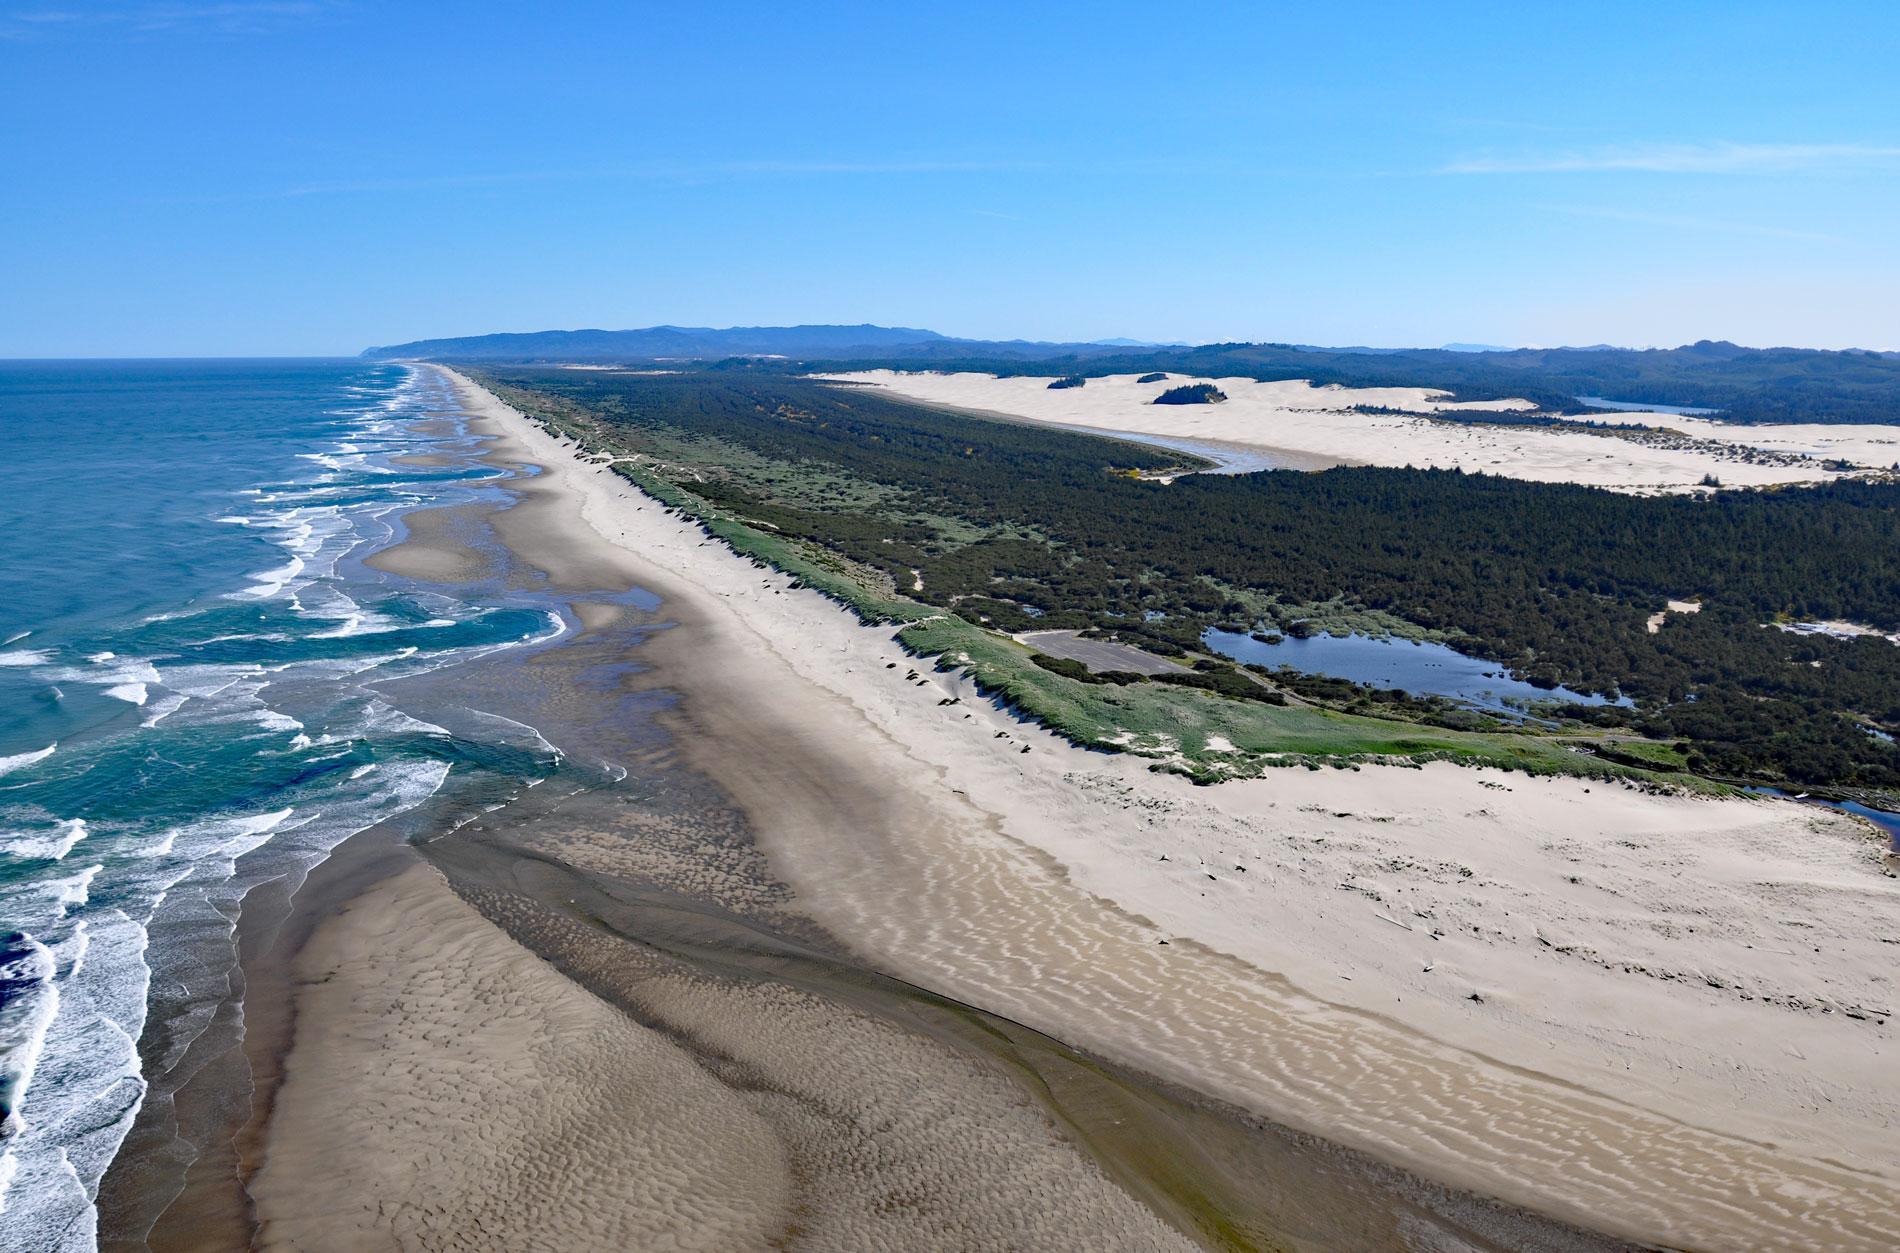
Siltcoos River begins at the outlet of Siltcoos Lake and meanders generally west for 3 miles (4.8 km) through the Oregon Coastal Dunes to the Pacific Ocean, about 8 miles (13 km) south of Florence and 13 miles (21 km) north of Reedsport, Oregon. A watershed of 43,520 acres (17,611 ha) drains into Siltcoos Lake via Woahink, Fiddle, Maple, and Lane Creeks. Siltcoos Lake is shallow with about 80 percent of the surface area having depths less than 15 feet (4.6 m). The lake formed after the Last Glacial Period when melting glaciers caused a rise in sea level that drowned the lower reaches of coastal rivers causing sediments to be deposited as alluvial deltas. The fine glacial sediments created sand dunes that formed a barrier across the ancestral rivers, subsequently flooding shallow basins. The coastal dunes are characterized by a well-developed foredune adjacent to the beach. The foredune has vegetation that traps most of the sand blowing from the ocean so little sand is available for replenishing the active dunes to the east. The active dunes cover older stabilized dunes and marine terraces and bedrock of the Tyee Formation that developed during the Eocene and consists of marine sandstone of turbiditic origins.
The coastal dunes at the Siltcoos River were part of the traditional territory of the Siuslaw people. This is an area of open beaches, bordered by shifting sand dunes and steep, heavily vegetated mountainsides. Historically, there were about 34 villages with cedar plank houses. Their villages consisted of family members and tended to be autonomous. During the summers, families would move to hunting camps in the surrounding mountains. In 1832, the Hudson’s Bay Company bult Fort Umpqua on the north bank of the Umpqua River, about 9 miles (15 km) south of the Siltcoos River, to serve as a base for fur trading operations. In 1846, Great Britain transferred sovereignty of the Oregon Territory to the United States. In 1855, a treaty was drafted by the federal government to allow for the peaceful acquisition and settlement of the ancestral tribal lands. The treaty provided for compensation to the tribes in terms of food, clothing, employment, education, and health benefits, but Congress never ratified the treaty. In November 1855, President Franklin Pierce issued an executive order creating the Coast or Siletz Reservation encompassing 1,536,000 acres (621,597 ha) on a strip of land approximately 120 miles (193 km) long from Cape Lookout in the north to the Siltcoos River in the south and extending inland approximately 20 miles (32 km). As Oregon’s population grew, the reservation was reduced and fragmented and today it is 3,745 acres (1,515 ha), none on the coast.
The Oregon Coastal Dunes are over 100,000 years old and stretch along 40 miles (65 km) of the central Oregon coastline. Studies have determined that the youngest dunes are closest to the ocean and began forming about 7,000 years ago. The primary source of sand forming the Oregon Dunes are sediments transported from the mountains primarily by the Umpqua and Siuslaw Rivers and deposited along the coast. Alongshore currents then transport the sand in suspension and along the ocean floor parallel to the coast. Waves and tides tend to move sand towards (or away from) shore. When waves deposit sand on the beach, the prevailing winds blow the sand up the beach face. Dune formation is mainly dependent on the wind. In the summer the wind generally blows from the north and northwest averaging 12-16 mph (19-26 kph). Mountain barriers along the coast deflect the wind currents that form the dunes into many different shapes. In the winter the average wind speeds are generally much slower (except during episodic storms) and the direction is from the south and southwest. These winds move large amounts of sand, causing the dunes to be reshaped. Read more here and here. Explore more of the Siltcoos River and Oregon Coastal Dunes here:

