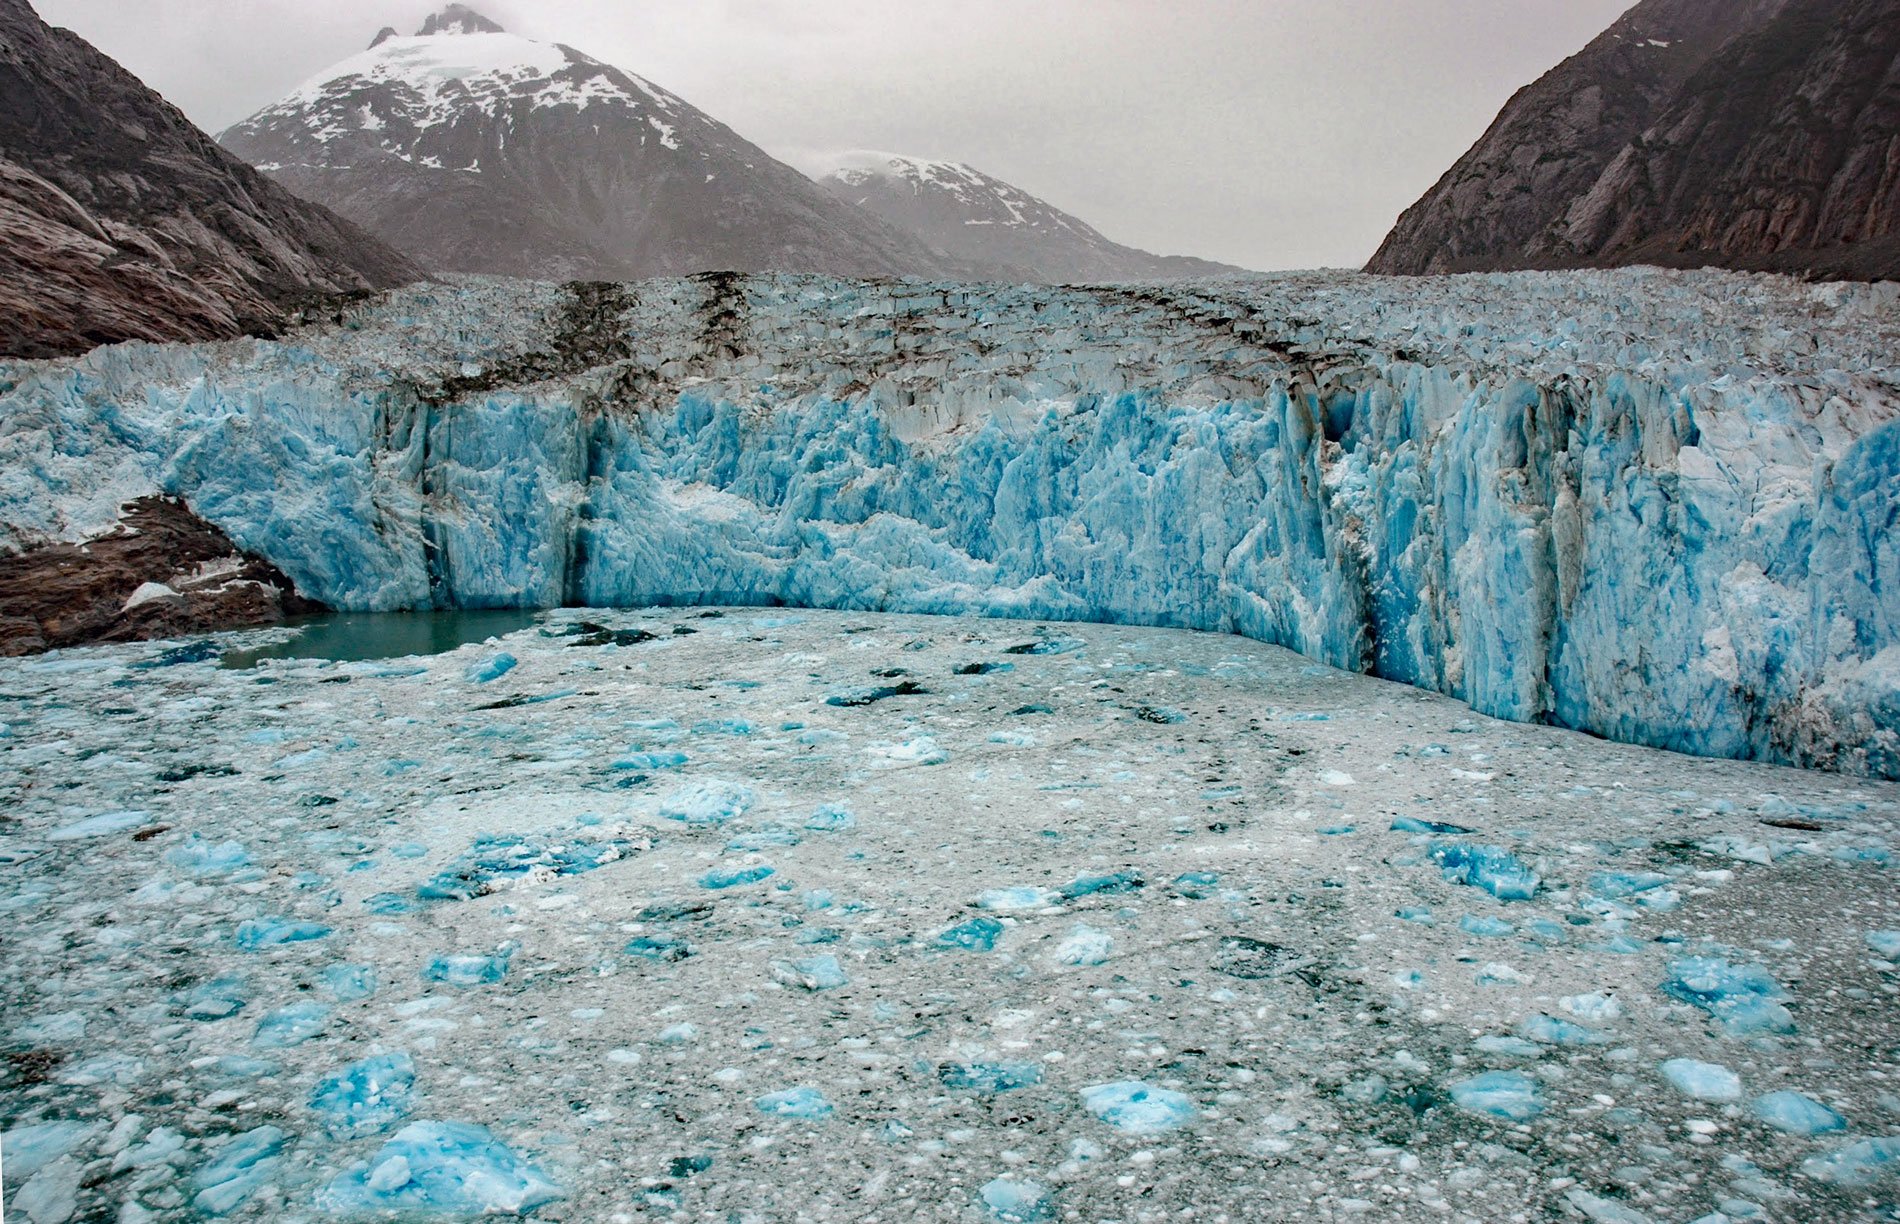
Dawes Glacier starts near the Alaska-Canada boundary and flows northwest for 20 miles (32 km) to tidewater in Endicott Arm, about 100 miles (161 km) northeast of Sitka and 80 miles (129 km) southeast of Juneau, Alaska. The glacier was named in 1891 by the U.S. Coast and Geodetic Survey for Henry Laurens Dawes, a lawyer and statesman in Massachusetts from 1857-1875. The glacier was originally called the Young Glacier by John Muir for Reverend S. Hall Young, who was a traveling companion in 1880.
Dawes is notable for the Dawes Act of 1887, which was intended to stimulate the assimilation of Native Americans by ending tribal government and control of communal lands. The Act was especially directed at the tribes in what was then Indian Territory and provided for the allotment of tribal lands to individual households of tribal members, and for granting them U.S. citizenship. In addition, this extinguished tribal land claims in this territory, despite the U.S. government pledging that the land would be theirs in perpetuity. This later enabled the admission of Oklahoma as a state in 1907.
The majority of glaciers in southeast Alaska and adjoining Canada are thinning and many of them very rapidly. Some of the largest ice losses in southeast Alaska are occurring at tidewater glaciers such as LeConte, South Sawyer, Dawes, and Muir Glaciers. Tidewater glaciers become unstable when the terminus retreats from a protective shoal into a deep basin and rapid calving of the glacier terminus ensues. Although the retreat may be triggered by climate, these calving retreats become independent of climate as part of a tidewater glacier cycle. Once begun, the retreat phase of this cycle is subject to increasing positive feedback as surface slopes and flow velocities substantially increase at the terminus and throughout the length of these glaciers, causing significant drawdown of the parent ice field. Read more here and here. Explore more of Dawes Glacier here:

