Communities
Recent Articles
More Articles
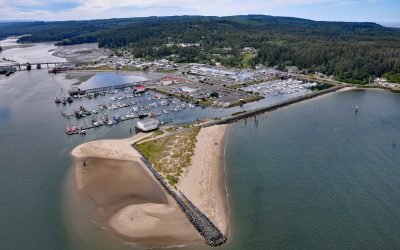
Oregon Institute of Marine Biology, Charleston
The Oregon Institute of Marine Biology is the marine station of the University of Oregon located a the mouth of Coos Bay, about 7 miles (11.3 km) southwest of North Bend and 0.3 miles (0.5 km) north of Charleston, Oregon.
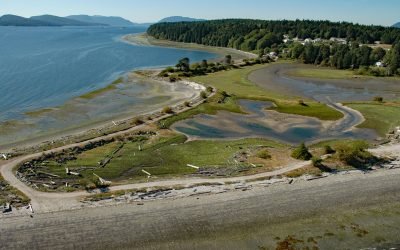
Penelakut Island, Trincomali Channel
Penelakut Island is located in the southern Gulf Islands between Vancouver Island and the mainland Pacific coast, about 40 miles (65 km) north-northwest of Victoria and 32 miles (52 km) southwest of Vancouver, British Columbia.
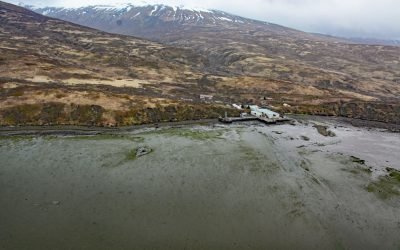
Chignik Fisheries, Chignik Lagoon
Chignik Fisheries is a facility, formerly owned and operated as a cannery by Wards Cove Packing Company, located on the northwest shore of Chignik Lagoon, southwest of Dago Point, about 44 miles (71 km) south of Port Heiden and 36 miles (58 km) northeast of Perryville, Alaska.
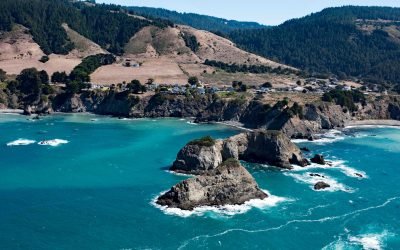
Casket Rock, Elk
Casket Rock is the outermost of three large rocks west of the community of Elk, about 22 miles (35 km) south-southeast of Fort Brag and 13 miles (21 km) north of Point Arena, California.
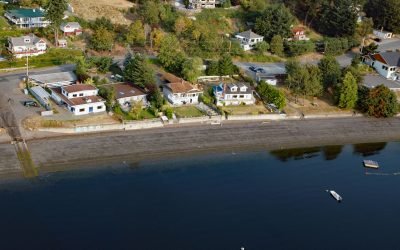
Maple Bay, Sansum Narrows
Maple Bay is a community located on Sansum Narrows, a narrow inlet in the Salish Sea that separates Vancouver Island from Salt Spring Island, about 29 miles (47 km) northwest of Victoria and 28 miles (45 km) southeast of Nanaimo, British Columbia.
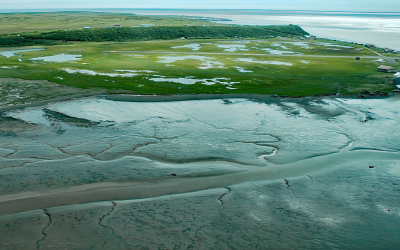
Clark’s Point, Nushagak Bay
Clark’s Point is the site of a historic community and salmon cannery located on the eastern shore of Nushagak Bay at the mouth of Clark Slough, about 57 miles (92 km) west-northwest of Naknek and 14 miles (23 km) south-southwest of Dillingham, Alaska.

Salmon Creek, Sonoma Coast State Park
Salmon Creek starts at an elevation of 570 feet (174 m) and flows generally southwest for 19 miles (31 km) draining a watershed of 22,487 acres (9,100 ha) between the Northern Coast Ranges and the Pacific Ocean at Salmon Creek Beach in Sonoma Coast State Park, about 20 miles (32 km) southwest of Santa Rosa and 2 miles (3.2 km) northwest of Bodega Bay, California.
About the background graphic
This ‘warming stripe’ graphic is a visual representation of the change in global temperature from 1850 (top) to 2019 (bottom). Each stripe represents the average global temperature for one year. The average temperature from 1971-2000 is set as the boundary between blue and red. The colour scale goes from -0.7°C to +0.7°C. The data are from the UK Met Office HadCRUT4.6 dataset.
Click here for more information about the #warmingstripes.