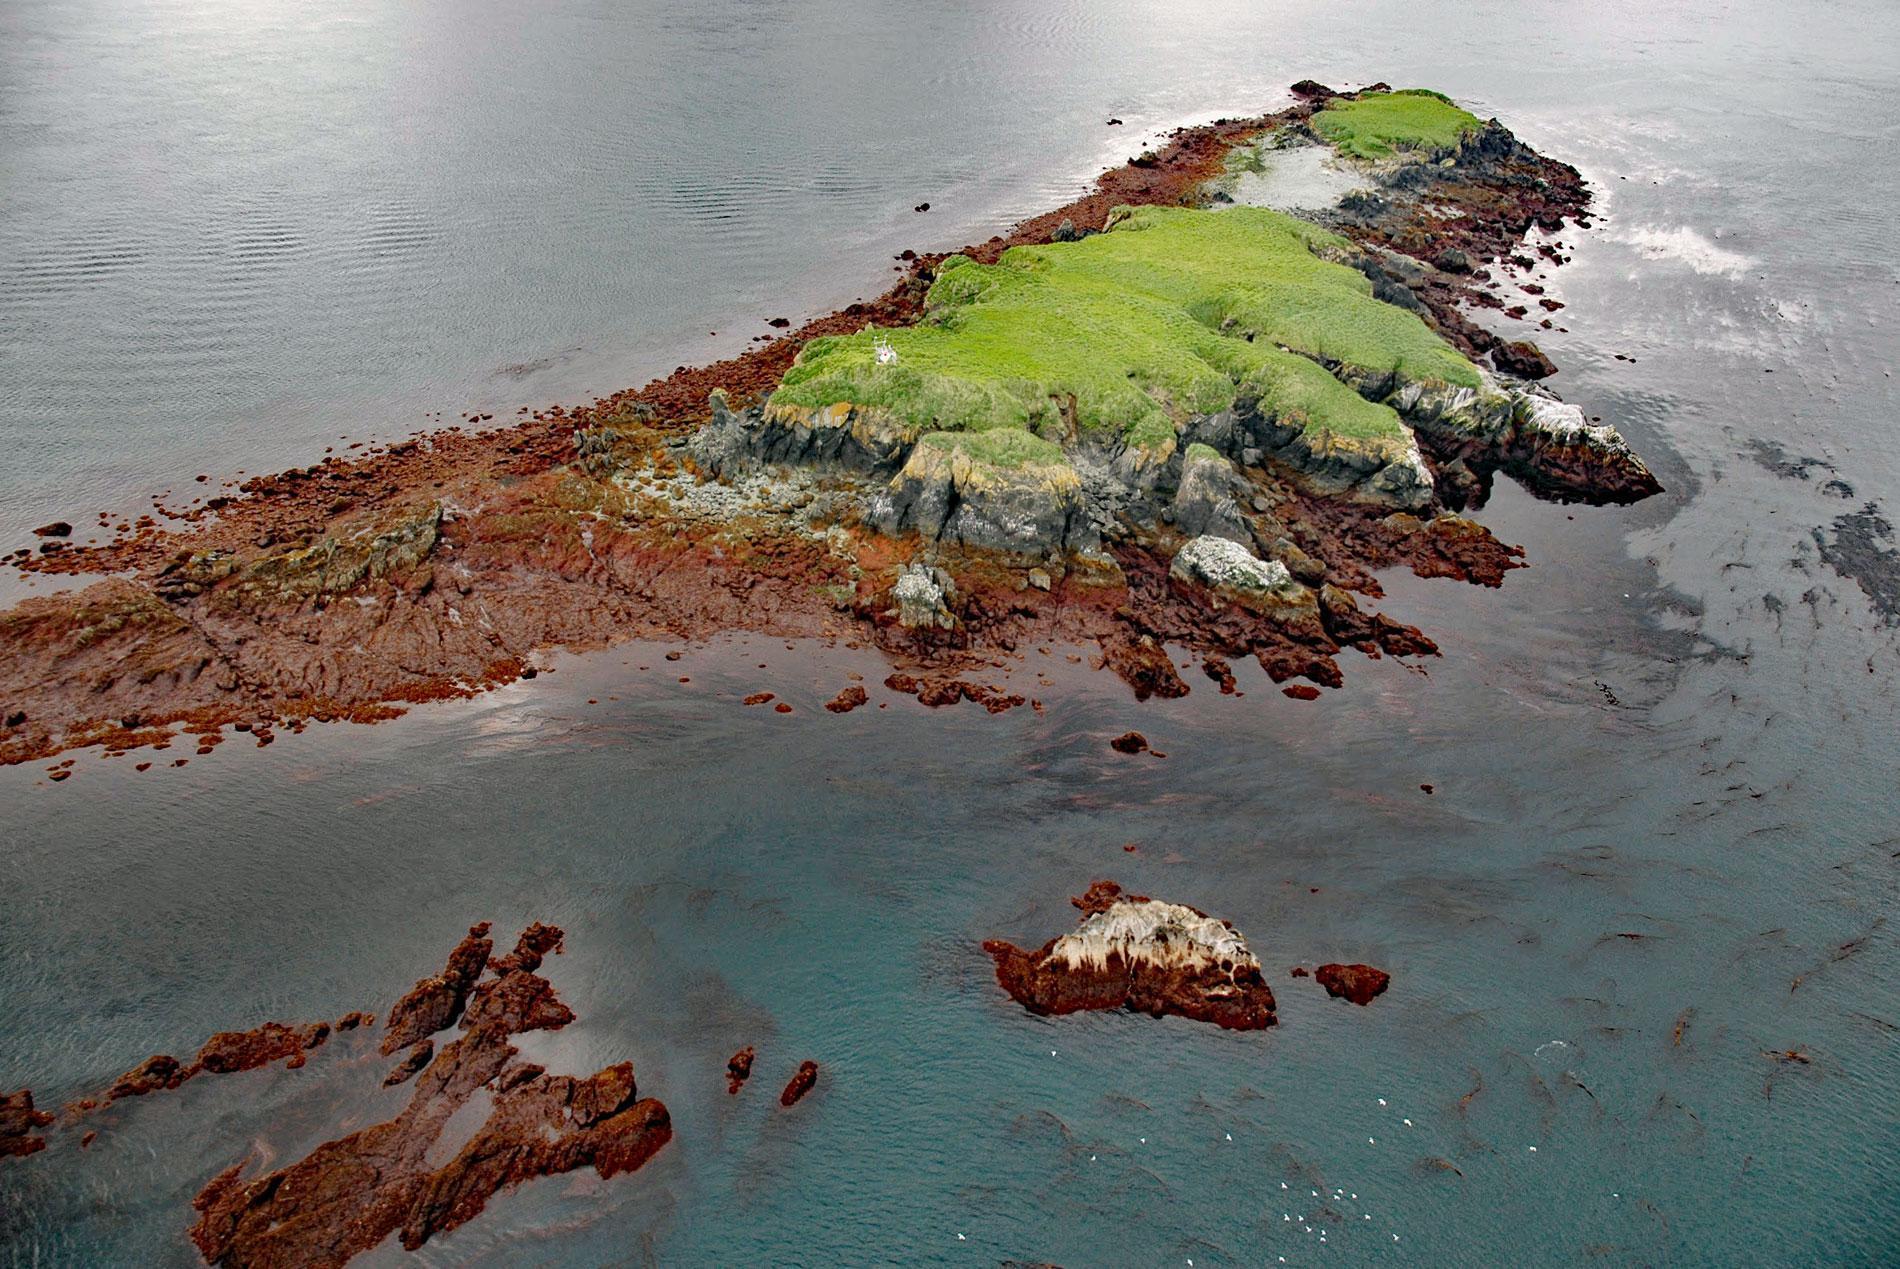
Flat Islands are situated about 0.8 miles (1.3 km) offshore and 1 mile (1.6 km) north of Point Bede on the Kenai Peninsula along the southern shore of Kachemak Bay in southern Cook Inlet, about 31 miles (50 km) south of Anchor Point and 3 miles (5 km) southwest of Nanwalek, Alaska. The descriptive name was given by William H. Dall in 1880 and published on charts by the U.S. Coast and Geodetic Survey. The islands are treeless, grass-covered, and composed of two islands connected by a reef that bares at low tide and surrounded by a bull kelp forest. Point Adam is about 5 miles (8 km) to the south and that headland was originally named Cape Bede by Captain James Cook in 1778 after Saint Bede. In 1908, the U.S. Coast and Geodetic Survey renamed the headlands. The southwestern end of the Kenai Mountains represents the Peninsular terrane that developed as an island arc during the Triassic and Jurassic, or about 200 million years ago. The terrane was intruded by a quartz diorite pluton during the Jurassic between 200 and 145 million years ago, and accreted to North America by the Early Cretaceous, or about 140 million years ago. This pluton is exposed at Point Bede and the Flat Islands and consists of plagioclase, quartz, biotite, and hornblende which are very resistant to erosion.
The Chugach Sugpiaq people inhabited the outer coast of the Kenai Peninsula between Prince William Sound and Port Graham living in semi-permanent settlements. In the mid 1780s, the Russian fur trade exploited the sea otters along the outer Kenai Peninsula and established trading posts at Cape Douglas, Nuchek and at Alexandrovsk, which is present-day Nanwalek. The Chugach Sugpiaq left their traditional settlements in the 1880s and moved to these trading centers for jobs, schools, and the Russian Orthodox churches, but they continued using their traditional sites for seasonal hunting, trapping, and fishing. Salteries and canneries were established in the late 1800s and early 1900s by some of the same companies that operated fur trading posts. The first salmon trap was built in Cook Inlet in about 1885 and patterned after the pound nets used in the Great Lakes fisheries. This type of salmon trap became known as a pile trap because whole log piles were driven into the sandy bottoms to support the trap and the webbing and wire netting were fastened to the vertical piles to form the walls. By the 1930s, Fidalgo Island Packing Company operated a cannery at Port Graham and 4 fish traps in Kachemak Bay with one on the north shore between Travers Creek and Diamond Creek, and three on the south shore at MacDonald Spit, Point Naskowhak, and in the channel between Flat Island and the Kenai Peninsula.
The Flat Islands form a good radar target that provides an important navigational aid used by large vessels bound for Kachemak Bay or Upper Cook Inlet. The Flat Island Light is on a skeleton tower, 70 feet (21 m) above the water, with a red and white diamond-shaped daymark on the northwest point of the northernmost island. Flat Island is also the location of a Coastal-Marine Automated Network, or C-MAN weather station. C-MAN weather stations are part of a meteorological observation network along the U.S. coast. The network consists of about 60 stations installed on lighthouses, at capes and beaches, on nearshore islands, and on offshore platforms. The stations record atmospheric pressure, wind direction, speed and gust, and air temperature. Some are designed to also measure sea surface temperature, water level, waves, relative humidity, precipitation, and visibility. The network is maintained by the National Data Buoy Center of the National Weather Service, which is part of the National Oceanic and Atmospheric Administration. Data from the C-MAN station at Flat Island are telemetered and ingested into numerical weather prediction computer models. Read more here and here. Explore more of the Flat Islands and Kachemak Bay here:

