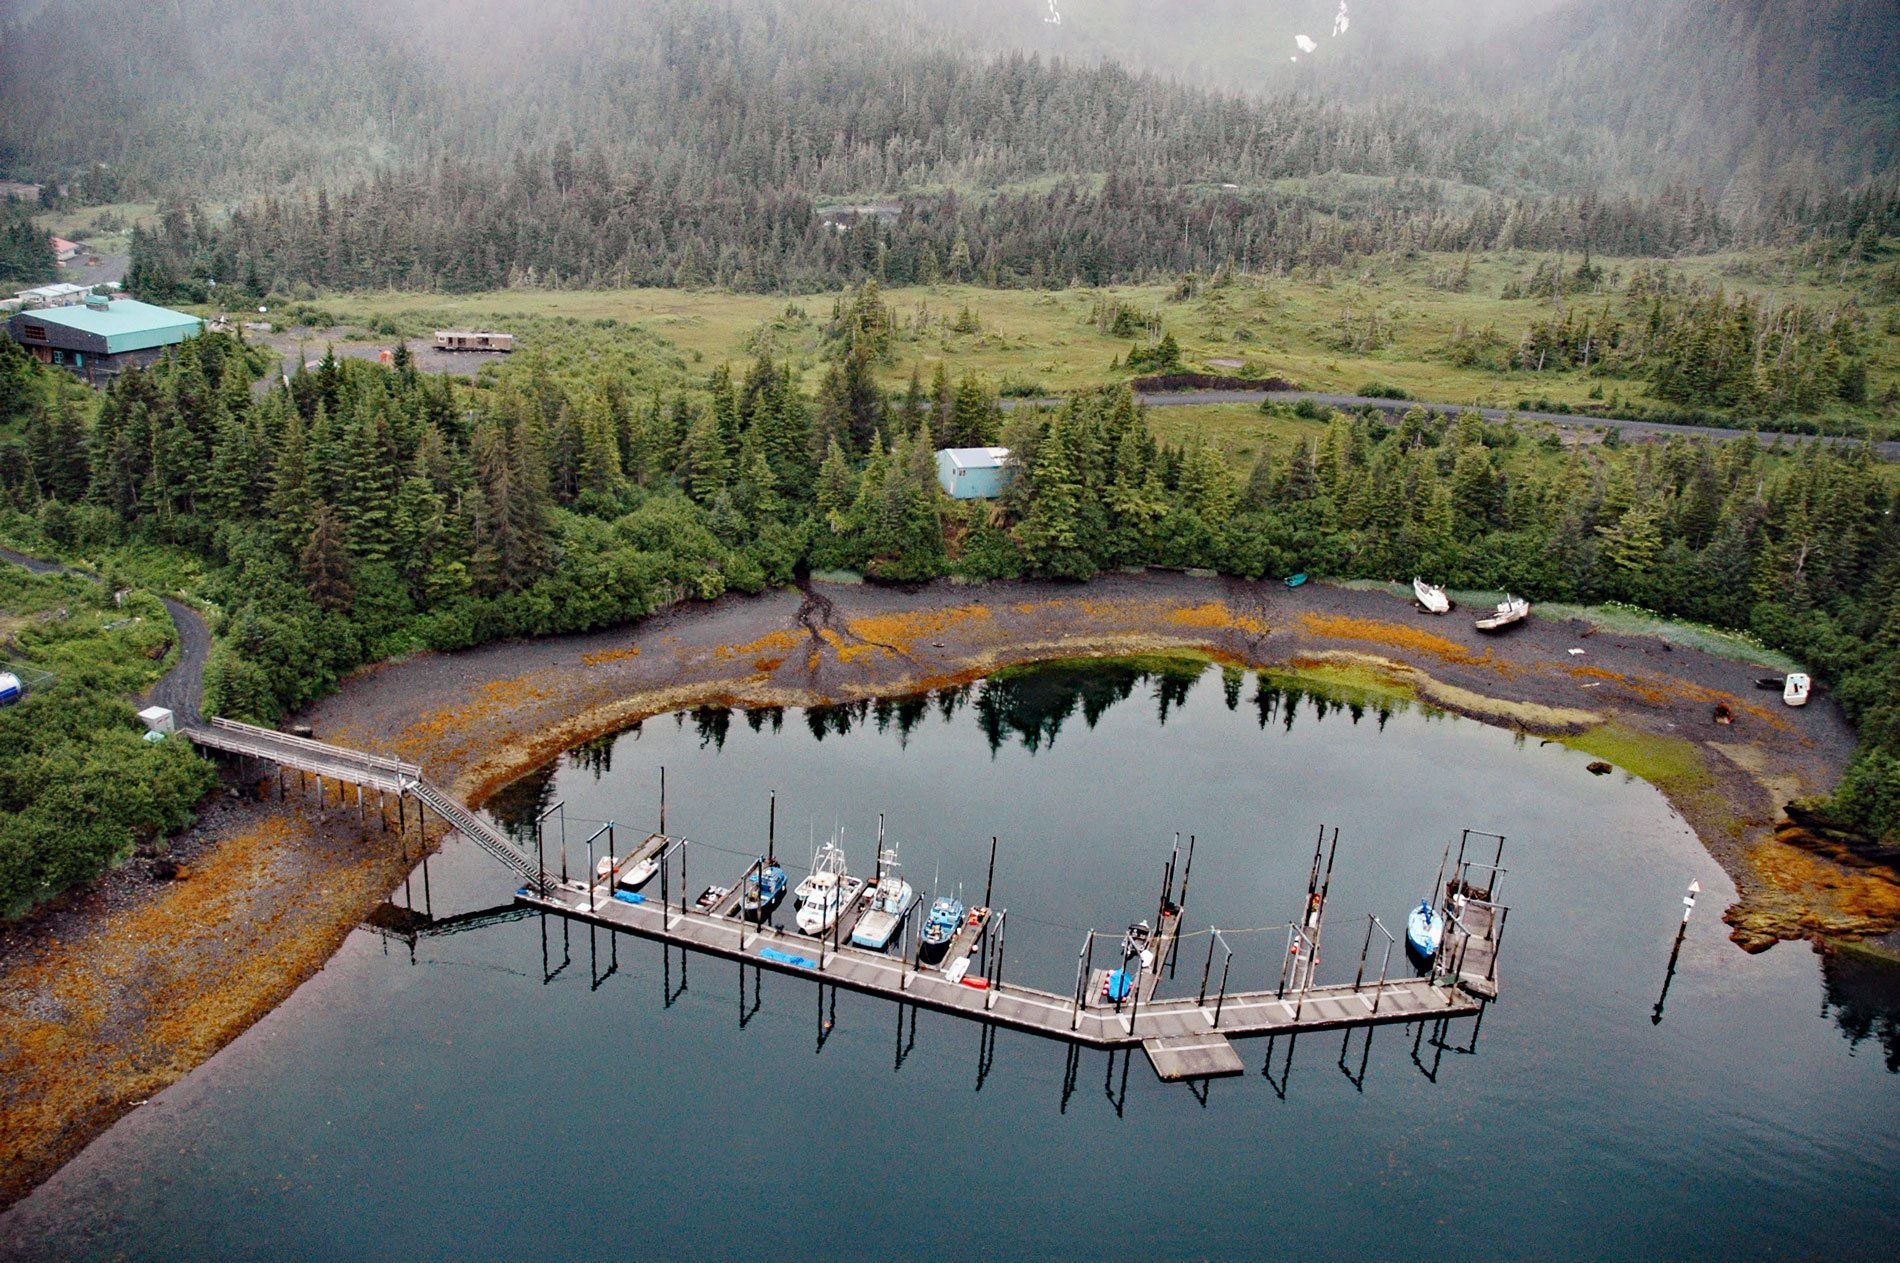
Chenega is a village located on the western shore of Crab Bay, on the southeastern coast of Evans Island in Prince William Sound, about 84 miles (135 km) southwest of Cordova and 49 miles (79 km) east of Seward, Alaska. The village is named after the Chenega people, and the word means “Beneath the Mountain”. The primary business area of the village includes the village council offices, a community center, the Russian Orthodox church, a small boat harbor, and the Alaska Marine Highway ferry terminal.
The people of the Chenega tribe have lived in Prince William Sound for thousands of years. They are part of the Alutiiq family and they speak a dialect called Suqcestun (sooks-toon). One of the oldest villages was on the southern tip of Chenega Island. In the 1700s, Russian trappers and explorers found their way to the Chenega village and first introduced the Russian Orthodox religion. The March 27, 1964 earthquake and the resulting tsunami destroyed all of the buildings in old Chenega village with the sole exception of a single home and the village school. Over a third of the village residents were killed and the survivors were taken initially to Cordova and then were later resettled in the village of Tatitlek by the Bureau of Indian Affairs.
In 1971, the U.S. Congress enacted the Alaska Native Claims Settlement Act. This Act granted the original residents of Chenega title to over 70,000 acres (28,328 ha) of land in Prince William Sound, and establishing the Chenega Corporation in 1974. In 1977, the Alutiiq Natives that enrolled in the Chenega Corporation selected their new village site at Crab Bay. This site was carefully chosen to meet the needs of a subsistence lifestyle. In 1982, one family moved to Evans Island and between 1984-1991 about 26 other families migrated to the new village. Read more here and here. Explore more of Chenega here:

